

GIS Compression Techniques
Raster data is comprised of grid cells. Unlike its vector counterpart that is comprised of vertices and paths.
Accuracy depends on cell size. Cell size must be small enough to capture the required detail. And as resolution increases, the size of the cell decreases. But this comes at a cost for speed of processing and data storage.
Raster storage in its raw state is inefficient because it is normally stores values row-by-row from the top left corner.
Have no fear:
The way to improve raster size efficiency is through GIS compression. And there are several ways to use GIS compression to reduce file size and still maintain quality of data.
Let’s take a look at some examples how rasters are compressed:
Run Length Encoding – Grouping Rows of Data
Run length encoding stores cells on a row-by-row basis. Instead of recording each individual cell’s values, run length encoding groups cell values by row.
Take this line of data:
AAAAAABBBBCCCCCCCCC
It can be rendered as:
6A4B9C
This GIS compression method reduces data volumes because each line is recorded more efficiently. Even though the same information is being held, values that are the same are stored as a string.
In the example above, the first row is blank and is stored as (0,8). This means there are 8 cells and they are all zeros. In the second row, there are 4 consecutive zeros so it gets a value of (0,4). After this, we have three consecutive cells with the value 1 so it gets a value of (1,3). This continues until it reaches the bottom-right cell.
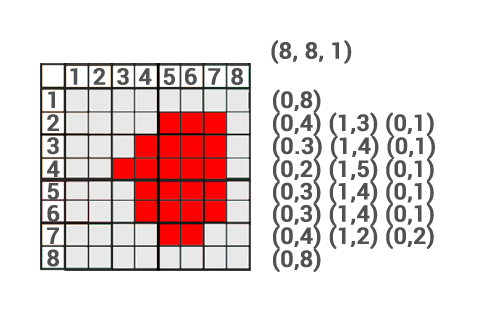
Run Length Encoding (Click to Enlarge)
Block Coding – Grouping Blocks of Data
The block coding raster storage technique assigns areas that are blocks to reduce redundancy.
The block coding raster storage technique subdivides an entire raster image into hierarchical blocks. It’s an extension of the run length encoding technique, but extends it to two dimensions.
In the example above:
Instead of storing 64 grid cells, all it takes is just 7 blocks. Using block coding, it requires one 3×3 block, two 2×2 blocks and four 1×1 cell blocks to encode this raster image.
In this block coding example, the top-left corner is used as a reference for each block.

Block Coding (Click to Enlarge)
Chain Coding – Defining the Exterior Boundary
Chain coding defines the outer boundary using relative positions from a start point. The sequence of the exterior is stored where the endpoint finishes at the start point.
During the encoding, the direction is stored as an integer. However, in this example we use cardinal directions for simplicity. For example, the value 0 is north and 1 is east.
In the example, we start at position (5,2). From here we define the border using cardinal directions and number of movements. We move east 3 positions until we hit the edge. At this location, we move south 4 positions. This process continues until the end point hits the start point.
Note: Only for the purpose of this exercise, we used north, east, south and west as alphabetical values. When encoded, it is a numerical value.
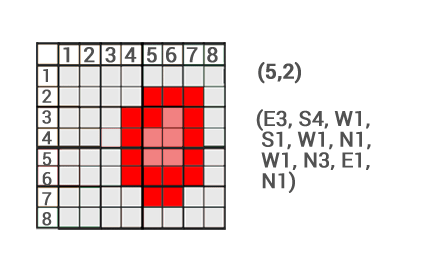
Chain Coding (Click to Enlarge)
Quadtree Encoding – Subdividing Data Into Quarters
Quadtrees are raster data structures based on the successive reduction of homogeneous cells. It recursively subdivides a raster image into quarters. The subdivision process continues until each cell is classed.

Quadtrees (Click to Enlarge)
It reduces raster storage requirements. It also is dependent on the complexity of the feature and the resolution of the smallest grid cell.
In the example, the top-left and bottom-right 8×8 grids do not need to be subdivided further because they are homogenous. The top-right 8×8 grid is subdivided into three 4×4 grid. The remaining 4×4 grid is separated into 4 individual classes.

Quadtrees of Earth
Lossless vs Lossy Compression
For GIS compression, it can be divided into two categories – lossy and lossless. Lossy GIS compression reduces file size by permanently eliminating certain information, especially redundant information (even though the user may not notice it). JPEG is an example of a format using lossy compression.
When should you use lossy compression in GIS?
In GIS, lossy compression data is good for background images because it has faster loading speeds with lower compression ratios. You should not choose lossy compression if you want to perform further analysis on the data.
On the other hand, lossless GIS compression reduces file size but redundant information will be retained after compression. LZ77 is an example of a lossless compression.

Lossy vs Lossless Raster Compression (Click to Enlarge)
When should you use lossless compression in GIS?
Lossless compression is good if there will be new analysis on the data. This is because none of the original values will be changed. It’s good for discrete data or the raster image is already lossy compressed.
Question: Why would anybody choose lossy compression over lossless compression?Lossy compression algorithms often result in greater reductions of file size. It’s often the case that the human eye cannot distinguish between lossless and lossy compression. Lossy compression offers the best compression ratios with good enough approximations.
JPEG Compression
JPEG stands for Joint Photographic Experts Group, which is the group that created the standard. It has an extension of .JPG and .JPEG and is the most common image format used by digital cameras and on the World Wide Web.
It’s a lossy compression type for digital images. Lossy compression reduces file size but redundant information will be lost (even though the user may not notice it). The user decides how much loss to introduce with a trade-off storage size and quality. The compression quality is a range from 1 to 100. A lower value compresses the raster image, but also reduces the quality more than a higher value.
JPEG 2000 (JP2) is the newest version of JPEG. It slightly improves GIS compression performance over JPEG using two different wavelet transforms. Users can choose low to high levels of compression.

Lossy Compression
LZ77 Compression
LZ77 compression is a lossless compression meaning it maintains raster values during compression. It was introduced by Abraham Lempel and Jacob Ziv in 1977 and is still used today. Combining the first letter from both last names (LZ) and the year it was invented (1977), this is how the acronym (LZ77) was created.
It uses the same commission algorithm as PNG (Portable network graphic). It’s the default raster GIS compression used in ArcGIS because
The theory behind LZ77 compression is that repeat values seen in a raster image are stored according to their position and length. Instead of storing single values for each cell, LZ77 simply stores where the value was found and how long the string of values are.
MrSID vs ECW
JPEG 2000 can achieve a compression ratio of 20:1 which is similar to MrSID and ECW format.
LizardTech’s proprietary MrSID (Multiresolution Seamless Image Database) format is commonly used for orthoimages in need of compression. MrSID images have an extension of SID and are accompanied with a world file with the file extension SDW.
MrSIDs have impressive compression ratios. Color images can be compressed at a ratio of over 20:1. LizardTech’s GeoExpress is the software package capable of reading and writing MrSID format.
ECW (Enhanced Commission Wavelet) is a compressed image format typically for aerial and satellite imagery. This GIS file type is known for its high compression ratios while still maintaining quality contrast in images.
ECW format was developed by ER Mapper, but it’s now owned by Hexagon Geospatial.
GIS Compression Means Reducing Raster Filesize
GIS data is abundant. With satellites acquiring images each day, raster data is the spatial model of choice. There are several GIS compression available.
Deploying efficient raster GIS compression techniques means reducing storage space. This is the primary benefit of compressing your data.
It can save money and time. You can also improve your network performance because you are working with a reduced amount of data.
We’ve provided you with an overview of raster encoding techniques to help you on your journey to saving valuable disk storage. It’s your turn to experiment with GIS compression and the benefits it can serve you or your organization.

 Annual sum of Global horizontal irradiation (GHI), average 1994-2010


