Εμφάνιση αναρτήσεων με ετικέτα Forest monitoring. Εμφάνιση όλων των αναρτήσεων

Δευτέρα 14 Δεκεμβρίου 2015

Finding Where U.S. Forests Have Been Undisturbed for a Quarter Century


Forest in Yellowstone National Park

Dr. Chengquan Huang is a Research Professor in the University of Maryland’s Geographical Sciences Department. This afternoon at the 2015 AGU Fall Meeting, Dr. Huang presented a poster explaining where to find U.S. forests that have been undisturbed for last 25 years. His research relied on Landsat to both find these forests and understand forest disturbance trends in the U.S.


Figure 1. High concentrations of undisturbed forests are distributed mostly in the northeast, north central, and western U.S., often along ecoregion boundaries. Image credit: Huang et al.

Presentation title:Where are the forests in the United States “not disturbed” over a quarter century?

Figure 2. Percent forest remaining undisturbed (PFUD) within a time interval decreased following an exponential decay function in the conterminous U.S. and each of its four regions as the time interval increased. Image credit: Huang et al.


  • About 1.7 million square kilometers, or two thirds of 2.6 million square kilometers of forest in the conterminous U.S. did not experience any detectable natural or anthropogenic disturbance during the quarter century between 1986 and 2010 (see figure 1)
  • The northern states in the eastern U.S. have the highest percentage of forest remaining undisturbed, while those in the south have the lowest values
  • At any given time interval, the percentage of forest remaining undisturbed decreases following an exponential decay function as the time interval increases (see figure 2)
  • If forest disturbance rates remain relatively stable over time, the conterminous U.S. would have less than 20% forest remaining undisturbed in 100 years, which would become less than 4% in 200 years
  • Management approaches aimed at reducing timber harvest rates in the south and mitigating fire risks in the west are needed in order to maintain higher levels of undisturbed forests.


What insight did you gain from Landsat that would have been impossible to glean otherwise?

  • Without Landsat, we wouldn’t be able quantify the amount of forest undisturbed over multiple decades at local, regional, state, and national scales;
  • We wouldn’t be able to reveal that the percentage of forest remaining undisturbed at any given time interval decreases following an exponential decay function as the time interval increases, and therefore wouldn’t be able to estimate how much forest would remain undisturbed over multiple centuries.

What are the major implications of your findings?

  • Old growth forests (> 100-200 years): mostly in the north and west, very little in the south, may constrain the distribution of species that favor old growth forests;
  • Forest carbon stock: because old growth forests typically have higher carbon density than young forests, the south have more potential to increase its forest carbon stock than other forested regions in conterminous U.S.;
  • Management approaches aimed at reducing timber harvest rates in the south and mitigating fire risks in the west are needed in order to increase and maintain higher levels of undisturbed forests.

Τετάρτη 25 Νοεμβρίου 2015

Putting the Trees Back on the Map: How GIS is Helping Reforest South America


BY DEVON REESER
GIS tools have revolutionized tracking in the sometimes hazy field of reforestation in developing countries. Deforestation contributes to more greenhouse gas emissions than the entire global transportation sector. Clean Development Mechanism (CDM) programs borne from the Kyoto Protocol have burst onto the international funding scene to pay forest-rich, poorer nations for forest ecosystem services, whether that means reforesting or not deforesting. Hundreds of other private businesses offset their carbon emissions by funding forest “carbon sinks” as well, as part of their corporate social responsibility charters, usually in partnership with NGOs.

Many, if not most, of the countries where reforestation is most viable have fuzzy systems of accountability, however, as well as gaps in technology know how and systems to implement tracking. Illegal logging often negates efforts. South America is home to more than a third of the world’s remaining rain forests and has possibly the most potential to reforest with a relatively low population and easily convertible land. But nearly all countries in South America score under 40 on a scale of 100 on Transparency International’s Corruption Index – and hence it has been difficult to ensure trees will stay put.

New, simplified Web-based GIS systems and UN trainings as part of the Reducing Emissions from Deforestation and Degradation (REDD) program of the UN Convention on Climate Change are revolutionizing forest tracking in South America. Here are three innovative examples from South America of how GIS is being used to strengthen and control forest monitoring to put – and to keep – the trees back on the map.
Monitoring Reforestation in Paraguay
Paraguay has suffered the most from deforestation for monoculture agriculture of any of its Latin neighbors. Only 10% of primary forest cover is left, gone in only 60 years, mostly for soy and cattle production by foreign entities.[i]The NGO, A Todo Pulmon, Paraguay Respira (With All Its Lungs, Paraguay Is Breathing) is tackling reforestation head on and using GIS to monitor and measure. The goal of the project, begun in 2009 by a national radio personality, was to plant 14 million trees – 85% to restore the Bosque Atlántico del Alto Paraná (BAAPA, the Atlantic Rainforest) and 15% for urban areas and schools as an educational initiative to spread the importance of reforesting the Atlantic Rainforest. It has planted 40 million.[ii]

The challenge now is to monitor to make sure they stay there. Paraguay is the most corrupt country in the Americas – it is the 27th most corrupt in the world on the Corruption Index, and has been in the top 10 in the new millennium. Though a “Zero Deforestation” law has been in existence for nearly a decade, officials often look the other way when illegal logging occurs. To date, the country has lacked the capacity to monitor and mitigate that corruption and crime. World Wildlife Federation is training every municipality in the forest districts to use GIS monitoring with satellite imagery from Brazil’s Space Research Institute.[iii] GIS satellite images are matched with the GPS coordinates of trees planted to track if reforested trees have been cut, and, if so, landowners pay heavy fines per national law and ramped up police monitoring spurred by enhanced media coverage and social consciousness.
Tracking Deforestation in Ecuador
With help from REDD, Ecuador is serving as a model country to input data into a simplified reforestation and deforestation Web-based GIS portal.[iv] A challenge for Ecuador in preserving the Amazon is a desire and need to develop petroleum resources within its most dense forest area. Not only does the portal easily show deforestation in protected areas and biodiversity corridors with petroleum and natural resource development, but it also shows overlap of reforested areas. The information helps policy makers and other investors immediately visualize effects of development and identify priority conservation areas. The web-based system does not require expensive software purchases and can hence be used across the nation by forest land managers and other specialists to keep one full, up to date resource publically available. The information was shared at a conference in Buenos Aires to replicate in Argentina.


ECUADOR REFORESTATION PLOTS FROM SISTEMA ÚNICO DE INFORMACIÓN AMBIENTAL.
Exposing Illegal Loggin Using GPS in Brazil

The ability of NGOs and the media to expose illegal activity is a new method of creating social accountability and transparency that supersedes corrupt policing and state-based systems. Greenpeace activists used covert GPS surveillance to track illegal logging in the Amazon. Activists placed GPS trackers on logging trucks to find their destinations, and then shockingly show with GIS satellite imagery illegal logging deep within protected forest. The Brazilian government is now being pressured to overturn a 2013 law weakening control.[v] The full report, The Amazon’s Silent Crisis: Night Terrors was published in October 2014 and is being read all over the world.

The prevalence and easy technology transfer of GPS and GIS has now made it possible to monitor and make sure that, even in the most unpoliced, corrupt areas of the world, trees meant to be on the map are put there and stay for good.

References
[i] Mongabay. 2014. Paraguay.

[ii] WWF Global. 2014. With All its Lungs, Paraguay is Breathing.

[iii] WWF. March 2011. Making a Pact to Tackle Deforestation in Paraguay (PDF).

[iv] UN REDD Programme. 2014. National Programmes in South America strengthen capacities on forest monitoring and web-based geographic information systems. REDD Programme Newsletter. September 2014.

[v] Carrington, Damian. 15 Oct. 2014. Activists Use GPS to Track Illegal Loggers in Brazil’s Amazon Rainforest. The Guardian.


Source: GIS Loung - Maps and GIS

Παρασκευή 6 Νοεμβρίου 2015

Forest Atlas Informs How Woodland Changes Affect Earth


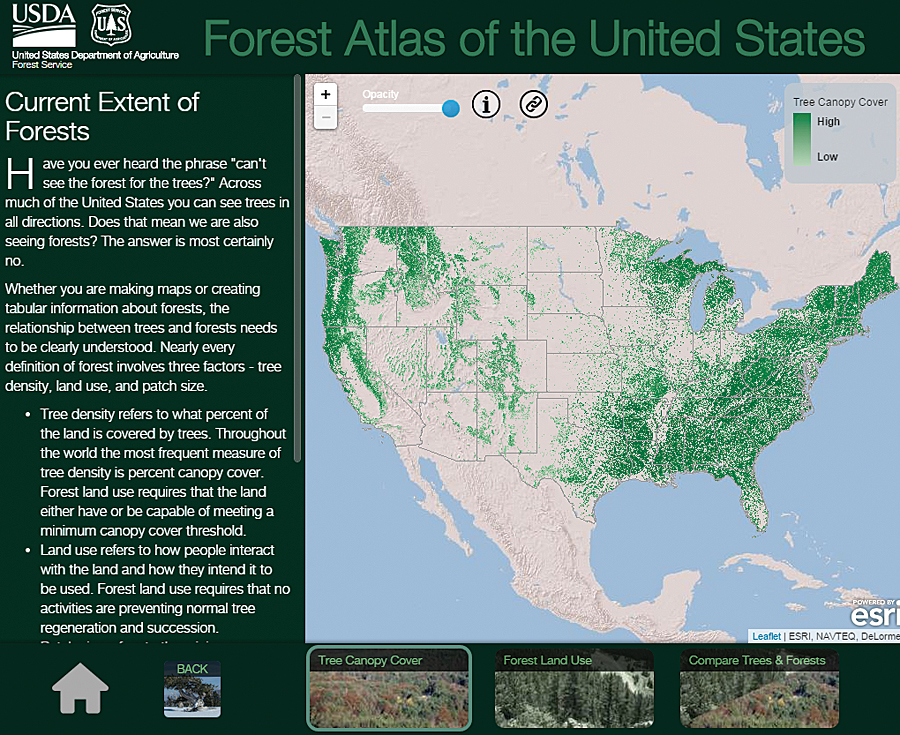
An interactive GIS atlas tells a story about what the world was like in the past, what it's like right now, and what we can ask of it in the future. The US Forest Service (USFS) has one such GIS atlas, the Forest Atlas of the United States.

The Forest Atlas "represents a new strategy and architecture for sharing data, information, and knowledge with policy makers, resource managers, landowners, and constituents," explained project manager and research soil scientist Charles "Hobie" Perry.

Built on Esri technology, the Forest Atlas is a resource for answering questions about how changes in forests affect people and the earth.

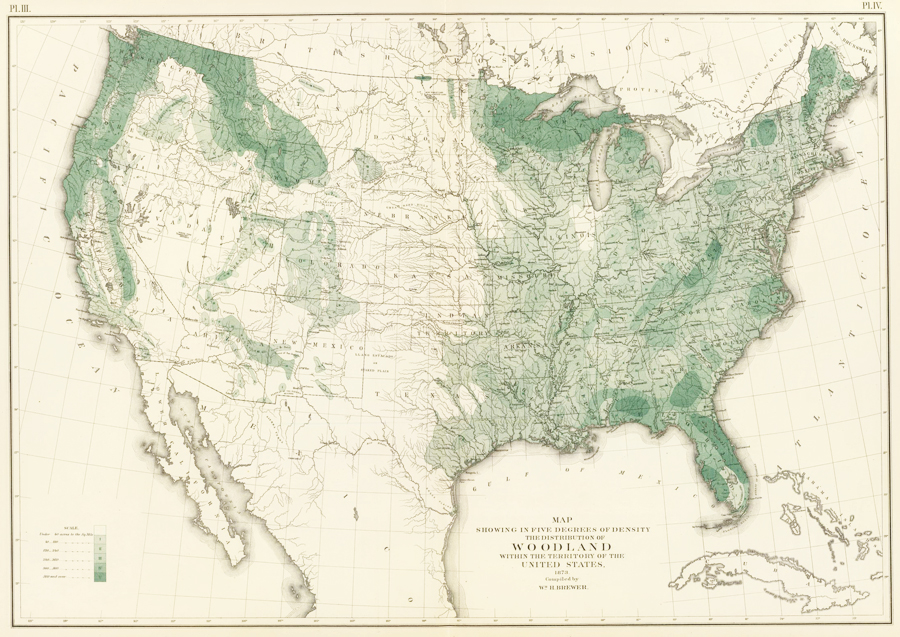
This 30-meter digital data of tree canopy cover has superseded William H. Brewer's map of woodland density from 1873.

This 30-meter digital data of tree canopy cover has superseded William H. Brewer's map of woodland density from 1873.

This 30-meter digital data of tree canopy cover has superseded William H. Brewer's map of woodland density from 1873.

A Bountiful Archive of Forest Maps
Forest maps have a long history in the United States. In 1873, William H. Brewer of the US Census Bureau produced one of the first maps of forests and woodlands. In 1898, George B. Sudworth, a dendrologist in the early Forest Service, published hisCheck List of the Forest Trees of the United States, Their Names and Ranges. From that, he and his team used contour maps of the United States to record where various forest flora could be found. The Forest Service and the US Geological Survey then published these maps in a loose-leaf volume in 1913—the firstForest Atlas of the National Forests of the United States.

But due to all the legwork that went into producing this, only one volume was published.

Forest Inventories Help Track Change
In 1928, the USFS began the Forest Inventory and Analysis (FIA) program, which manages information on forest conditions and reports on sylvan trends. FIA inventories describe the location, health, age, and tree species of forests. Forest managers need this information to write sustainable forest plans; understand the risks of fire, insect, and disease outbreaks; and schedule treatment activities such as harvests—all to maintain forest health.

This information has wider reaching applications as well. Water resource managers use forest data to trace water life cycles. State forest managers use it to track insects, diseases, and invasive species so they can implement effective treatments. Scientists rely on forest measurements to calculate how much carbon dioxide should be captured and stored for carbon sequestration. Natural resource planners also build strategies and design policies using forest changes measured over time.

Reviving the Forest Atlas
Because more forest analysts and scientists are incorporating geospatial analysis into their work, FIA is paying more attention to geospatial technology. Recently, the USFS decided to revive the Forest Atlas project to better organize its tremendous amounts of spatial data, and it used Esri technology to rebuild the resource.

The foundation for the new Forest Atlas is a set of highly accurate forest maps derived from FIA and other research projects. FIA inventories nearly 1,000 different plant species across 12 time zones, from Puerto Rico and the Virgin Islands in the Atlantic Ocean to the Marshall Islands and Palau in the Pacific Ocean. FIA recognizes species according to the US Department of Agriculture's Plants Database to eliminate the inherent biases that can arise when people inventory forests according to their own needs.

In addition to showcasing FIA inventory data, the Forest Atlas features datasets and information from across the agency. This includes the Forest Health Technology Enterprise Team's National Insect and Disease Risk Map, the Monitoring Trends in Burn Severity Program's burn severity and fire perimeter maps, and other researchers' historic tree species migration maps and future range projections.

In the Forest Atlas, this information is combined with other forest attributes to tell a comprehensive story about the forces shaping US forests and the ecosystem services they provide.

"Good data tells a very significant story," said FIA's national program manager Greg Reams. "This helps us demystify reasons why species shift in the forest. Geospatial analyses tell a story of change, [allowing] us to track invasive species and understand how these events are occurring."

The Forest Atlas addresses other related but broad forestry concerns as well, including changes in employment trends, biomass availability, land cover, and land use. It also helps the USFS, firefighters, and other responders better manage wildfires and aids scientists in analyzing carbon sequestration potential.

More Inclusive Fire Management Strategies
Fires are a natural event in any wooded landscape. When strategically managed, they help forests grow stronger and healthier. But native and invasive pests, overcrowded clusters of forest, and drought conditions reduce forests' resilience to fire and increase the likelihood that fires will be catastrophic.

The USFS and its partners need to integrate fire as a critical natural process in land and resource management but control wildfires that pass through properties with various ownership structures, all while implementing the best available science.

The Forest Atlas lets stakeholders and policy makers share essential knowledge for making environmentally sound and cost-effective fire management decisions. Sharing open data on GIS platforms ensures that everyone can understand and participate in these critical decisions.

Forecasting Carbon Sequestration Capabilities
US forests offset about 16 percent of the nation's annual carbon emissions, according to the USFS, making the Forest Atlas invaluable for designing carbon mitigation strategies.

People involved in discussions about climate change and carbon are very interested in forests' past; current; and, most of all, future carbon sequestration rates. These people are particularly keen on seeing various mapped-out scenarios that project carbon storage rates over the next 10 to 30 years.

Using Esri model building tools, researchers can construct simulations of future carbon sequestration based on variables such as population growth, fluctuations in gross domestic product, and changes in forest age and density. Forest Service scientists can also use projected climate scenarios—ranging from warm dry seasons to mild wet seasons—to calculate the effects these different conditions would have on future forest growth, including changing forest areas and carbon sequestration rates over the next 30 years. Analysts can then use these projections to forecast economic development such as housing starts, future lumber demand, and the quantity and quality of water that will be derived from forested ecosystems.

Complex and connected scenarios such as these are easier to understand when presented as geospatial displays. For example, positive and negative carbon storage levels can be represented as a range on a map so the resource community can see areas that need management action and policy makers and city planners can see what the effects will be.
Making the Forest Atlas Accessible

The Forest Atlas is available on the USFS GIS platform and is published in accordance with the Federal Geographic Data Committee's metadata standards. This makes it easy to integrate the information with other open data across government organizations.

"I see us aligning with other agencies, not just in a statistical manner but in a geospatial manner," Reams concluded. "Geographic metadata makes it easier to track monitoring information such as the shifts among land-use and land-cover categories, particularly forests, agriculture, and urban landscapes. The open-source data platform enables data integration among agencies in ways that will prove highly meaningful."


The general public can also access the atlas via ArcGIS Online and through the US government's open-source spatial data website.

Source: ESRI

Κυριακή 11 Οκτωβρίου 2015

Aerial LiDAR and forest inventory monitoring


LiDAR (light detection and ranging) is a remote sensing technique that is based on measuring the time it takes a laser pulse to strike an object and return to the source. Typically, a laser scanner is flown in an airplane, the exact location of which is tracked by a GPS satellite. State-of-the-art scanners are capable of transmitting and receiving as many as 500,000 pulses of laser light per second, resulting in data that can be used to map the reflecting object in high three-dimensional detail.


Aerial LiDAR systems capture 3D data of forests from above the canopy.

Natural Resources Canada’s Canadian Wood Fibre Centre (CWFC) and its partners have become national leaders in the application of advanced technologies such as aerial LiDAR for forest inventory. CWFC researchers are working with industry and other partners across the country to help industry transform its management of fibre supply through the use of LiDAR.


Aerial LiDAR data are used to generate predictions of forest structure and wood fibre attributes across the landscape.

For example, in Newfoundland and Labrador, a fibre inventory project is using aerial LiDAR and other technologies to identify and map various wood fibre properties, such as wood density and fibre dimensions and coarseness. Ultimately, the newly gathered information about fibre quality will add a new dimension to the existing forest inventory, which already contains information on a variety of land and tree attributes. The result will, in turn, enhance forest management activities and enable the industry to target specific source materials, thereby reducing production costs for wood fibre products.

Similar projects are taking place in Quebec, Ontario, and Alberta, developing applications of LiDAR and other technologies in enhanced forest inventory to meetspecific operational and strategic needs.

Τρίτη 6 Οκτωβρίου 2015

A forest by any other name? Semantics, carbon implications, and solutions


A team of researchers comparing eight satellite-derived global forest area maps have unearthed discrepancies as large as 6 percent of Earth’s land area—nearly the size of China. But their biggest discovery was not the discrepancy, it was the reason behind it.


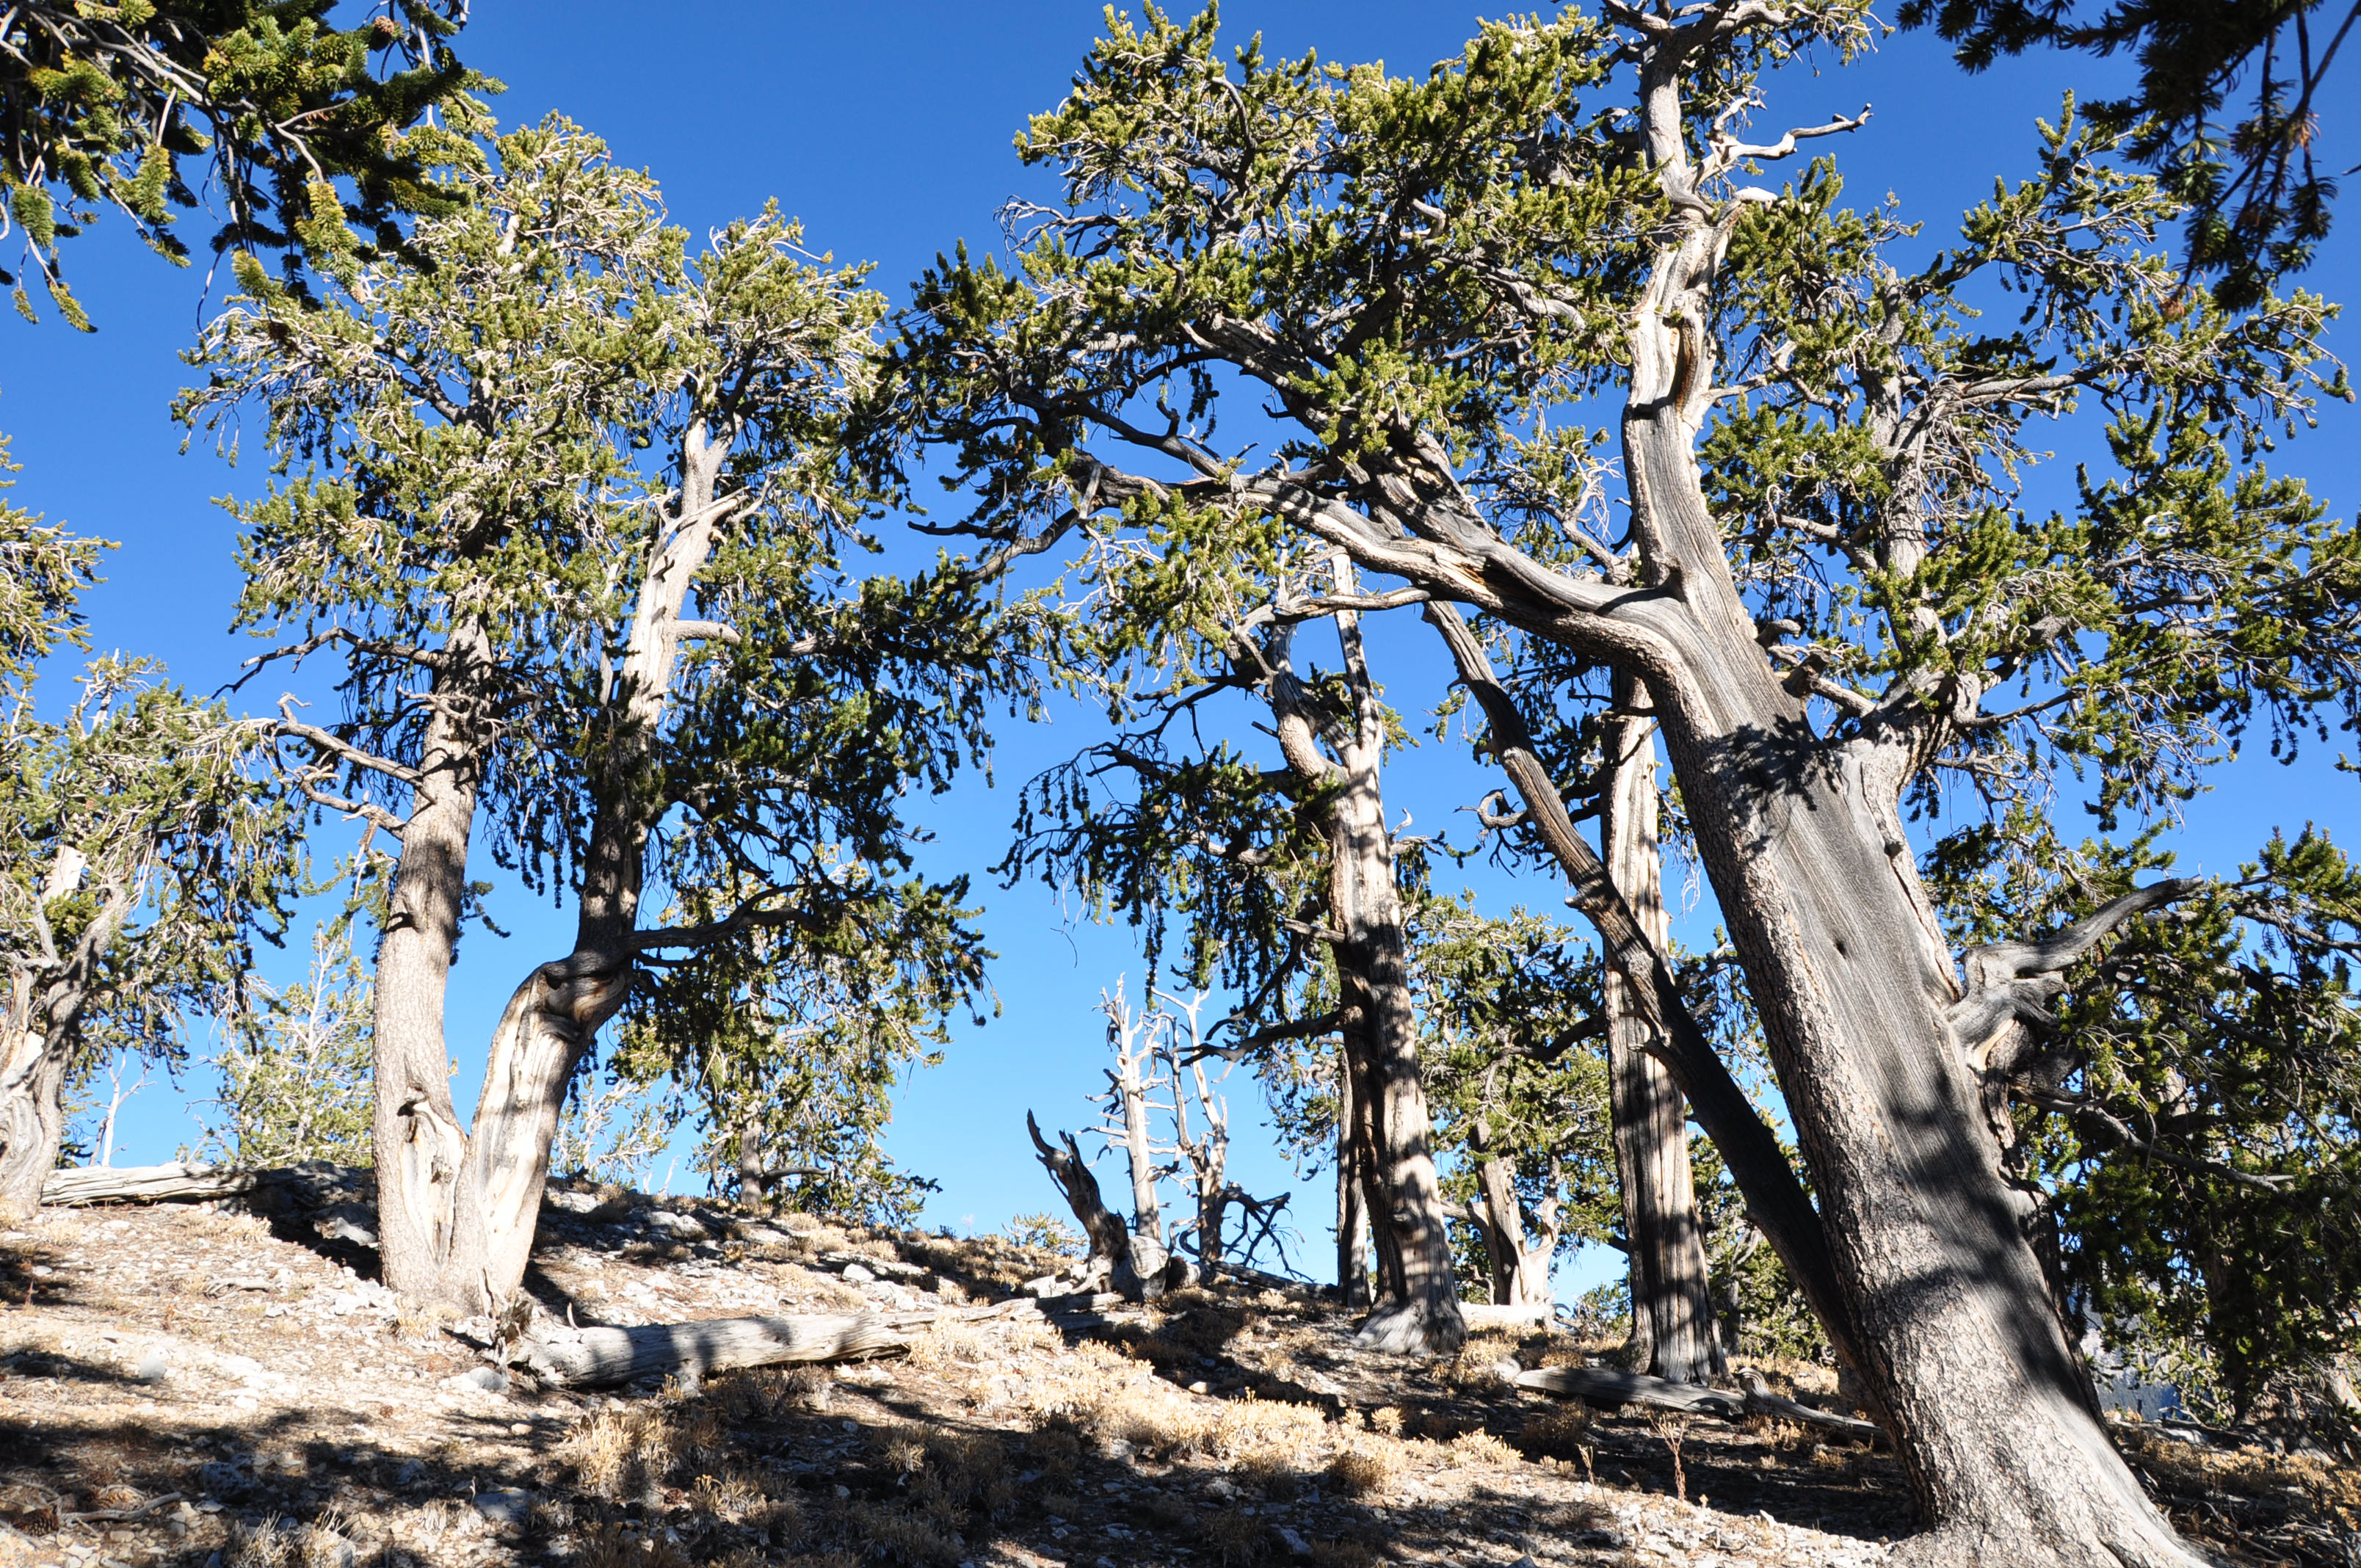
A ridge-top bristlecone pine forest in the Spring Mountains of Arizona. This sparse forest canopy is an example of where forest definition ambiguity can lead to map disagreement. Photo credits: Joseph Sexton, University of Maryland


Using the world’s first global, Landsat-based 30-meter resolution map of tree cover, the researchers found that ambiguity of the term “forest” has the potential to create discrepancies double the size of the 6 percent difference found between current maps. While ecologists have long understood the complexity comprised by the concept of “forest”, and while geographers have called for the term to be more uniformly defined across monitoring entities, no one had quantified the scope of the problem.


“Whereas previous studies mentioned the discrepancy, our analysis quantified and mapped it globally and connected it to estimates of biomass and economic value,” says Joseph Sexton, a senior scientist at the University of Maryland’s Global Land Cover Facility and lead author of the study.

The findings were recently published in Nature Climate Change by a team of researchers from the University of Maryland, NASA Goddard Space Flight Center, the National Wildlife Federation, the Global Environment Facility, and Duke University.

Error contributions of the technological issues that impede satellite-based forest maps—such as persistent cloud cover in the tropics, canopy shadows, and the complexity of forest structure—were shown to be small in comparison to this definitional divide.

“It’s not the technology’s fault. Today’s satellites provide us with a sufficient precision to make ecological measurements of forests,” Sexton says. The study found that the agreement between eight global satellite-derived forest cover maps (in terms of area) is massive. These maps, created by U.S. and European science agencies and universities, use both coarse and medium resolution satellite data, and rely on differing international definitions of forest. For example, “forest” is considered anywhere with at least 10 percent forest cover in some definitions, as opposed to at least 30 percent forest cover in others. Where and why the maps disagree is now better understood.


When different definitions of forest are used, satellite forest cover measurements can vary widely. Here global forest cover as measured by Landsat is shown using two different UN Framework Convention of Climate Change (UNFCCC) forest definitions: 10 percent tree cover (left) and 30 percent tree cover (right). Data are publicly available at www.landcover.org.


Savannah woodland in northern Botswana. This transition zone between open grasslands and closed canopy forest is typical of areas in Africa where forest definition ambiguity has major measurement impacts. Photo credit: Stuart Pimm, Duke University


The study found that because the definition of “forest” given by large international organizations (which satellite-based calculations reference) vary substantially, forest area calculations are severely compromised in areas of intermediate tree cover such as savannahs, shrublands, mountain ridge forests, and boreal taiga.


Semantics can sully global forest area measurements, and this is problematic because deforestation has major implications for greenhouse gas emissions, climate change and biodiversity reduction. It was early satellite-based maps of forest cover change that helped raise the alert about the widespread severity of global deforestation. This factored into the creation of policy initiatives such as the Kyoto Protocol, Aichi Biodiversity Targets, and REDD+ (Reducing Emissions from Deforestation and Forest Degradation).

Programs like REDD+ incentivize countries to keep forests intact and sustainably managed by assigning a value to the forest’s stored carbon. So accurate measurements of forest cover via synoptic, unbiased sources such as satellites are paramount—which means an unambiguous definition of forest is too. In the tropics, the authors found that definitional discrepancies could translate into $1 trillion worth of carbon credits.

To stem this ambiguity, the authors call for either a single, unambiguous definition of forest that can be used globally or a shift away from “forest/non-forest” maps to maps of measureable ecological characteristics like tree cover, canopy height, and biomass.


A spruce-fir forest near the mountaintop tree line of Utah’s Wasatch Mountains. Here, limited water and soil depth combine to keep the forest canopy sparse. This is an example of where forest definition clarity is essential in the Western U.S. Photo credit: Joseph Sexton, University of Maryland

“Through advances in remote sensing, we increasingly have the technical capacity to estimate the structure, cover, and composition of terrestrial ecosystems from space,” Sexton explained. If an international consortium of scientists agreed on a set of these measurable forests characteristics, better estimates of carbon stock could be made.


A prime example of where a clear forest definition has big implications is Southeast Asia, where the growth of the oil palm sector has skyrocketed in the last decade.

“The projected global increase in demand for palm oil is likely to cause widespread expansion of palm plantations in the region at the cost of forest,”
paper co-author and NASA Goddard/National Wildlife Federation scientist Praveen Noojipady explains.

Here, palm oil producers’ commitments to zero deforestation are colliding with increasing palm oil demand. Clearly defining where expansion can and cannot occur, based on a forest definition that accounts for carbon stock, will prevent biodiverse and carbon-rich native forests (and their dense under-canopy vegetation) from being turned into plantations, which are much less carbon-dense.

Source
“An unambiguous definition of forest including ecological characteristics will not only protect forests of High Carbon Stock (HCS), but also facilitate sustainable palm oil production with least damage to carbon rich ecosystems.”

With the insight gained by this research, scientists now have a blueprint for improving the satellite-derived maps that can help protect these carbon rich ecosystems.


Reference:

Joseph O. Sexton, Praveen Noojipady, Xiao-Peng Song, Min Feng, Dan-Xia Song, Do-Hyung Kim, Anupam Anand, Chengquan Huang, Saurabh Channan, Stuart L. Pimm, John R. Townshend, (2015). Conservation policy and the measurement of forests. Nature Climate Change,v. advance online publication, Nature Publishing Group DOI: doi:10.1038/nclimate2816.

Παρασκευή 2 Οκτωβρίου 2015

The most complete global map of forests available yet


By Aleks Buczkowski


Very interesting research has been published in Nature magazine. Researchers created the most detailed map of forests around the world. All the previous attempts to estimate the number have been done based on satellite images. The number of trees around the world was estimated at the level of 400 billion. Although remote imaging reveals a lot about where forests are, it doesn’t give an answer to how dense the forest is.

This time researches decided to take a dual approach. They gathered data from various existing ground-based counts of trees covering about 430,000 hectares around the world. These counts allowed them to improve tree-density estimates from satellite imagery. Then the researchers applied those density estimates to areas that lack of high quality ground data.

With this approach researchers calculated that the actual number of trees around the world is at the level of 3 trillion, so 8 times higher than previously counted. The result of this research has been published in the form of the density map.


The highest tree densities, calculated in stems per hectare, were found in the boreal forests of North America, Scandinavia and Russia. These forests are typically tightly packed with skinny conifers and hold roughly 750 billion trees, 24% of the global total. Tropical and subtropical forests, with the greatest area of forested land, are home to 1.3 trillion trees, or 43% of the total.


The study also estimated that we are cutting 12 billion trees a year. With that paste we will grub up the whole planet in less than 300 years… Frightening!

Source: Nature and Geoawesomeness

Πέμπτη 16 Ιουλίου 2015

Mapping Robinia Pseudoacacia Forest Health Conditions by Using Combined Spectral, Spatial, and Textural Information Extracted from IKONOS Imagery and Random Forest Classifier

Journal article by: Hong Wang, Yu Zhao, Ruiliang Pu and Zhenzhen Zhang


Abstract

The textural and spatial information extracted from very high resolution (VHR) remote sensing imagery provides complementary information for applications in which the spectral information is not sufficient for identification of spectrally similar landscape features. In this study grey-level co-occurrence matrix (GLCM) textures and a local statistical analysis Getis statistic (Gi), computed from IKONOS multispectral (MS) imagery acquired from the Yellow River Delta in China, along with a random forest (RF) classifier, were used to discriminate Robina pseudoacacia tree health levels. Specifically, eight GLCM texture features (mean, variance, homogeneity, dissimilarity, contrast, entropy, angular second moment, and correlation) were first calculated from IKONOS NIR band (Band 4) to determine an optimal window size (13 × 13) and an optimal direction (45°). Then, the optimal window size and direction were applied to the three other IKONOS MS bands (blue, green, and red) for calculating the eight GLCM textures. Next, an optimal distance value (5) and an optimal neighborhood rule (Queen’s case) were determined for calculating the four Gi features from the four IKONOS MS bands. Finally, different RF classification results of the three forest health conditions were created: (1) an overall accuracy (OA) of 79.5% produced using the four MS band reflectances only; (2) an OA of 97.1% created with the eight GLCM features calculated from IKONOS Band 4 with the optimal window size of 13 × 13 and direction 45°; (3) an OA of 93.3% created with the all 32 GLCM features calculated from the four IKONOS MS bands with a window size of 13 × 13 and direction of 45°; (4) an OA of 94.0% created using the four Gi features calculated from the four IKONOS MS bands with the optimal distance value of 5 and Queen’s neighborhood rule; and (5) an OA of 96.9% created with the combined 16 spectral (four), spatial (four), and textural (eight) features. The most important feature ranked by RF classifier was GLCM texture mean calculated from Band 4, followed by Gi feature calculated from Band 4. The experimental results demonstrate that (a) both textural and spatial information was more useful than spectral information in determining the Robina pseudoacacia forest health conditions; and (b) the IKONOS NIR band was more powerful than visible bands in quantifying varying degrees of forest crown dieback.


For full text follow the link here.

Παρασκευή 10 Ιουλίου 2015

Satellite images provide new view of uncontacted Amazonian communities


A laundry list of dangers threaten Amazonia’s few remaining uncontacted indigenous communities. Colonists and industry workers often grab tribal land for mining, logging, drug trafficking, or hydrocarbon extraction, which damage the groups’ environment and bring them into conflict with armed settlers. Careless encroachment by outsiders can also bring diseases to which uncontacted groups have no immunity.

Locating and keeping tabs on settlements is an important step in protecting communities from the advances of colonists and even government-sanctioned development. But this has often entailed direct contact or aerial surveys with low-flying planes, which cost researchers thousands of dollars per flight and cause undue stress to people being surveyed. A number of aerial images show villagers shooting arrows at planes or fleeing into the forest.

In the past few years, however, scientists have begun to explore using high-resolution satellite images to gather data on the location, population, and configuration of uncontacted communities. Surveys using these images can cost as little as US $10 per square kilometer and they provide higher-quality, more systematic data than aerial surveys. A study in the journal Royal Society Open Science uses images purchased from high-resolution image databases and the mapping software ArcGIS to locate and measure villages, gardens, and houses in five uncontacted communities near the Brazil-Peru border.

Western portion of site H that was monitored during the study. From 2012 to 2013 this site showed an increase in slash-and-burn fields that are designated by arrows, as well as an expansion of two large cleared areas in the center. These changes total 16 ha cleared in 14 months.

The study used tips from news stories and Brazil’s indigenous agency, Fundação Nacional do Índio (FUNAI) to get a sense of where the communities were located before zeroing in on them and eventually purchasing high-resolution images for specific areas.

The researchers were able to learn quite a lot about the communities by analyzing the satellite images. For instance, one village was visible in 2006 satellite images, but appeared abandoned and overgrown in 2012 images. A 2014 overflight showed the community had moved to a nearby location. And using population estimates from FUNAI, the team calculated that the communities surveyed had about two square meters of indoor space and .11 hectares of land for each inhabitant, making their living space an order of magnitude denser than that of most contacted tribes.

"As indigenous people acculturate, the density goes down quite dramatically," Robert Walker, an anthropologist at the University of Missouri who led the study, told mongabay.com. "We want to find and measure more isolated villages and compare them to contacted villages… and see how [both] move and change over time."

Satellite image of clearing and houses for a section of site F2 that was monitored during the study. 

The approach could also be used to monitor the effect of external threats like logging on indigenous communities’ populations and movements. Satellite images have the potential to significantly augment FUNAI’s existing strategies to protect uncontacted groups, like overflights and law-enforcement stations at remote forest outposts, the researchers write. "We could be much more vigilant of monitoring encroaching external threats, and at a lower cost, using a remote surveillance program that would alert a mobile team to help stop specific invasions into protected indigenous lands," said Walker.

Satellite monitoring did not identify individuals or faces and it involved spatial analysis rather than direct interaction, alleviating concerns about consent and privacy, Walker said. However, he was careful not to reveal the exact locations of the communities in his paper for fear that doing so "might facilitate some people causing harm to these isolated villages," he said.

According to the study, the ultimate goal of this work is the security of uncontacted people and specifically "a longitudinal surveillance program across Amazonia that can facilitate informed decisions by policy-makers to increase protection of isolated populations."


Uncontacted indigenous tribe in the Brazilian state of Acre. Photo by: Gleilson Miranda / Governo do Acre via Wikimedia Commons. 

Citations:
Walker RS, Hamilton MJ, Groth AA. Remote sensing and conservation of isolated indigenous villages in Amazonia. R. Soc. Open Sci. 1:140246. 2014.


Source

Παρασκευή 3 Ιουλίου 2015

GeoDigital, FLoT Systems, and Environmental Consultants Inc. (ECI) Partner for Unmanned Aerial Vehicle-based Utility Asset Inspection Program

First comprehensive remote asset inspection program combines UAV-collected data, software and utility expertise to safely and efficiently perform virtual inspections


ATLANTA, June 4th, 2015 /PRNewswire/ — GeoDigital, FLōT Systems, and Environmental Consultants Inc. (ECI) have formed a partnership to bring utilities remote asset inspection capabilities via Unmanned Aerial Vehicles (UAV) – also known as Unmanned Aerial Systems (UAS). The program combines high-resolution imagery collected by FLōT Systems’ beyond line-of-sight capable UAV, analytics and location-based work management software from GeoDigital, and virtual inspection of those images with utility vegetation and asset management expertise from ECI.


For the first time, utilities will be able to assess critical infrastructure on both electric distribution and transmission facilities, as well as on pipelines by using UAVs, commonly known as drones, to pinpoint possible risks to their infrastructure. In doing so, utilities can improve service reliability, increase employee and public safety and best ensure regulatory compliance.


“We believe UAS will become an invaluable tool in helping utilities manage their infrastructure and the environment around it,” said FLōT Systems’ CEO Chris Vallier. “As specialists in the utility industry, we have been developing the ability to utilize long-range unmanned aircrafts to more safely and efficiently collect higher value facility information than with traditional methods.” With respect to the regulatory environment, Mr. Vallier goes on to say, “We understand how to operate within the current regulatory framework while helping our clients prepare for full-scale commercial activity in the near future.”


“By combining UAV collection and utility inspection expertise with GeoDigital’s virtual asset inspection software, utilities can now enhance their inspection programs by deriving actionable insights from big geospatial data,” said Chris Warrington, President and CEO at GeoDigital. “Virtual inspections use geospatial data, which can now be collected more frequently and safely, so utilities can prioritize remote asset maintenance and repairs using up-to-date data. This geospatially-precise work planning increases reliability and enables safer, more efficient field crew deployments. By going to digital inspections and having a history of all work activity, utilities can achieve significant process improvements and cost savings.”


“Because vegetation and equipment-caused failures are among the top causes of electric distribution system interruptions, our team has focused on providing virtual facility and vegetation inspections as our first end-to-end solution,” said Jim Downie, Executive Vice President of ECI. “For example, imagery collected to virtually identify high-risk trees or equipment maintenance needs can be tracked back to the field using GeoDigital location-based work management software. This is just the first example of the common vision of ECI, GeoDigital and FLōT to enable informed digital decisions that drive real returns for electric and gas utilities and their customers. We anticipate the business case for UAV and other remote inspection methods will further optimize utility engineering and vegetation management by taking advantage of LiDAR and other sensing technologies in the not-too-distant future.”


To find out more visit the company websites below.


About GeoDigital


GeoDigital, a big spatial data and analytics company, helps industries efficiently manage critical assets and the world around them. GeoDigital’s innovative solutions combine 3D maps – built on remote sensing and imaging technologies such as LiDAR – with patented analytics and location-based work management software. By providing precision insights, GeoDigital enables customers to predict threats and prioritize actions to solve complex geospatial challenges. With data-driven confidence, GeoDigital helps to guide people, autonomous cars, machines and infrastructure more safely, reliably and productively.


Founded in 2005, GeoDigital has operations in the United States, Canada, and Australia and its investors include NGP Energy Technology Partners, North Sky Capital, EnerTech Capital and Emerald Technology Ventures. Visit www.geodigital.com/UAV-inspections to find out more about this solution.

About Flōt Systems


Based in Lafayette, Colo., FLōT (pronounced FLOAT) Systems is a UAV-based technology company delivering next-generation aerial inspection systems to electric utilities and other critical industries. FLōT Systems leverages long range UAS that carry precision sensors that are useful in solving many electric utility challenges. FLōT Systems provides turnkey UAS services, FAA expertise for beyond line of sight operations, sensor and integration experience, and UAS software development for the utility industry.


www.flotsystems.com


About Environmental Consultants Inc. (ECI)


ECI provides quality solutions for all aspects of vegetation management, including program assessment, development, crew productivity measurement, environmental assessment, contract vegetation management field specialists, training, expert testimony, and research. We are committed to providing the highest quality state-of-the-art consulting services.


ECI is consistently at the forefront in the development of reliability-focused, risk-based, cost effective utility vegetation management programs. Clients implementing our program initiatives and recommendations have realized dramatic improvements in reliability, significant cost savings, reduced risk, enhance regulatory compliance and overall improvements in operational effectiveness.


Since its founding in 1972, ECI has been recognized as the proven industry leader in the strategic and tactical development of progressive UVM solutions and programs. ECI has successfully provided a wide variety of related consulting services for hundreds of utilities throughout the United States and Canada.

Πέμπτη 2 Ιουλίου 2015

Global Forest Watch Using High Resolution Synthetic Aperture Radar


Forests always have been an important for all human beings and animals. For some forests provide shelter and some forests are source of livelihood.


Monitoring global forest footprint is of particular interest and importance for scientific community. Remote sensing technique has played a vital role in in determination and estimation of global forest cover.


Since 1972, US Landsat satellite program (optical imaging) is well known for measuring forest cover. There are certain regions in the world such as tropical forest, which are under cloud cover most of the time in a year. Optical remote sensing senor couldn’t see beyond the clouds collect and hence put the limitation on global forest cover.


Global mosaics show phased-array type L-band synthetic aperture radar-2 color composites in (top) horizontal transmission/ reception (HH), horizontal transmission/vertical reception (HV), and HH/HV modes in red, green and blue, respectively, and (bottom) the corresponding map of forest areas (green)/non-forest areas (yellow)

Credit: SPIE


With advancement in technology, a new technology known as synthetic aperture radar (SAR) has revolutionized the remote sensing technology. SAR can see through the clouds and even in nights.


In a study by Masanobu Shimada et. al., titled “High-resolution satellite radar for mapping changes in global forest cover” has produced the global forest cover map for 2007–2010.


A high-resolution synthetic aperture radar (SAR) uses low-frequency microwaves, which enable forest and non-forest/other land use to be easily differentiated under all weather conditions. As of now only three SAR frequency bands are available for use in space. Of these three bands, the L-band of 23 cm wavelength has a higher ability to distinguish forest areas than the C-band of 5.6cm and X-band of 3 cm wavelength.


Scientist have used the phased-array type L-band SAR (PALSAR) was a high resolution multi-polarization low-noise radar, which was installed on the Advanced Land Observing Satellite (ALOS). ALOS has collected 2.1 million SAR images of 70*70 km in dimension of entire globe. They have also applied PALSAR data in HV mode to estimate forest cover and its annual variation.


Color composite image showing four-year variation of forest cover in western Indonesia and Malaysia.Credit: SPIE


Scientists have generated four global mosaics of PALSAR horizontal transmission/horizontal reception (HH) and HV polarization data at 25 m spatial resolution using data acquired annually from 2007 to 2010.


The first estimated global forest area was 38,542,500 sq. km from the ALOS/PALSAR data set, following the Landsat-based estimation of forest area as 40,656,570 sq. km . The difference can probably be attributed to a difference in the sensitivity of optical and L-band SAR techniques in measuring forest cover.


In summary, L-band SAR backscatter provides the basis of information regarding forest and non-forest areas on a global scale. The enhanced maps and classification of land use provide a new global resource for documenting the changing extent of forests and also offer opportunities to quantify historical and future changes through comparison with data from the Japanese Earth Resources Satellite-1 SAR (1992–1998) and ALOS-2/PALSAR-2 (from 2014).