Τετάρτη 30 Δεκεμβρίου 2015

Measuring plant health from space by FLEX


By Stefan Mühlbauer


FLEX is the name of an ESA satellite that is planned to be launched in 2022 in order to measure vegetation health from space. FLEX refers to fluorescence.

Fluorescence
Very generically, fluorescence is the spontaneous emission of light by a substance that has absorbed some kind of elextromagnetic radiation (for instance light). It is a form of luminescence. In most cases, the emitted light has a longer wavelength and therefore less energy than the absorbed radiation. A very well known example of fluorescence occurs when the absorbed radiation is in the ultraviolet region of the spectrum and therefore invisible to the human eye while the emitted light is in the visible region, which gives the fluorescent substance a distinct colour that can only be seen when exposed to UV light.


Chlorophyll fluorescence
Chlorophyll fluorescence refers to the light that is emitted by chlorophyll molecules during photosynthetic energy conversion from an excited to non-excited states induced by absorption of sun light. It occurs in all higher plants and algae. The conversion of solar energy into biochemically usable energy carriers (ATP and NADPH) is a complex and highly regulated sequence of light absorption, electron transfer and biosynthesis. The photochemical conversion is accompanied by a release of energy in form of heat and fluorescence. The properties of fluorescence can be measured and relate to the photosynthetic activity of plants.

Chlorophyll fluorescence is a well investigated effect. For instance, it is known that Chlorophyll fluorescence indicates most types of plant stress – water availability, extreme temperatures, etc. In plant physiology and ecophysiology “[…]chlorophyll fluorescence has become one of the most powerful and widely used techniques”[1].
Chlorophyll fluorescence in plants has two peaks occurring at wavelengths around 685nm (photosystem I) and 740nm. The full chlorophyll emission spectrum hence covers a wavelength range from red to near infrared between ~640-800nm.

FLEX
The fluorescence explorer, FLEX, is designed to measure the fluorescence of plants from space and will thereby yield important information on plant health and improve the understanding of the way carbon moves between plants and the atmosphere and how photosynthesis affects the carbon and water cycles.
FLEX will carry the Fluorescence Imaging Spectrometer (FLORIS) that covers the effective range of chlorophyll fluorescence between 500 and 780nm with varying spectral sampling and resolution of 0,1nm and 0,3nm respectively in the oxygen absorption bands. The spatial resolution will be 300x300m² covering the scale of individual agricultural and forestry management units.

Following a rigorous selection process, the satellite will be ESA’s eighth Earth Explorer, planned for launch by 2022. The FLEX satellite will orbit in tandem with one of the Copernicus Sentinel-3 satellites, taking advantage of its optical and thermal sensors to provide an integrated package of measurements.

Jan Woerner, ESA’s Director General, said, “FLEX will give us new information on the actual productivity of vegetation that can be used to support agricultural management and the development of a sustainable bioeconomy. It will therefore help to understand our ecosystem.”


Fluorometer used to measure plant stress in the field, an aready used practice.


Fluorescence image of adaxial leaf surface (32 x 24 mm) measured with IMAGING-PAM chlorophyll fluorometer. Wikipedia


Vegetation plant stress.


ESA Report for mission selection

1: Maxwell K., Johnson G.L., 2000: Chlorophyll fluorescence – a practical guide. Journal of Experimental Botany, Vol.51, No.345, pp. 659-668


260 years of global carbon emissions on a single map


By Aleks Buczkowski


Global warming is the most significant environmental problem facing us today, as we experience more and more weather anomalies every year. In long-term perspective it will probably make life harder, not easier, for most of us. This is mainly because we have already built enormous infrastructure based on the climate we now have. People in some temperate zones may benefit from milder winters, more abundant rainfall, and expanding crop production zones. But people in other areas will suffer from increased heat waves, coastal erosion, rising sea level, more erratic rainfall, and droughts.


Today we are able to estimate some of the consequences of the global warming for example the rising sea level. But in order to understand and prevent or at least slow down the process we need to look back and understand how has it all started. French economist Aurélien Saussay created the map which might help us to do that.

The Global Historical Emissions Map charts global carbon emissions over the course of 260 years. It is based on data from the U.S. Department of Energy’s Carbon Dioxide Information Analysis Center which gathered data about global emissions from fossil-fuel burning, cement production and gas flaring between 1750 and 2010. The dataset is weighted by population distribution over time and represented as a grid.


The map shows historical responsibilities of each region of the world in the total amount of carbon emitted. During the Industrial Revolution, Europe was the carbon hotspot for a close to a century. In 1891 U.S. surpassed the U.K. as Earth’s leading CO2 polluter. Since last decade, China is the leading CO2 polluter.

Cool project.

Δευτέρα 28 Δεκεμβρίου 2015

PrecisionHawk develops data and safety tools to take drone use to the next level


By Aleks Buczkowski


For many years, remote sensing was directly connected to collecting data with satellites and manned aircraft. Originally this was a truly game changing technology, but it had its limitations. These data gathering technologies, while effective, can be expensive and, in many cases, time inefficient.


Traditional remote sensing multispectral images


Over the years market needs have evolved and today’s decision makers require hyper accurate, hi-resolution data in a near real-time, which is difficult to achieve using traditional methods. This is where drones, previously used for military reconnaissance, entered the remote sensing arena. UAV flights can be conducted daily, for smaller areas, at low altitudes, resulting in higher resolution imagery at a fraction of the cost..


PrecisionHawk
– North Carolina-based start-up was one of the first who realised the potential of drones in remote sensing. In 2008 they started flying their first aircraft, The Lancaster, for commercial applications in Canada, specifically in the viticulture industry. The vision behind it was however much different from most of the players on the market. PrecisionHawk understood early on that the use of small UAVs goes far beyond data collection; the key is turning around actionable information, so a platform needs to include data processing and analysis. In the past, these functions were separated. Data was often collected by one company and then handed over to another organization for processing and analysis.


PrecisionHawk took a different approach and decided to build an end-to-end solution that did not require a pilot or remote sensing expert to operate and understand, but would allow an average grower to gather field data in the matter of minutes. Five years ago the idea seemed crazy, but today the approach introduced by PrecisionHawk is recognized as industry standard.


All you need is a tablet or laptop with the dedicated map platform where you mark area you need to survey. Than you simply throw the plane into the air. Everything else is done automatically. The aircraft computes flight paths, survey parameters, take-off and landing paths on its own. Once the survey is complete, the on-board computers will automatically connect to Wi-Fi networks and transfer all remote sensing data, flight information and diagnostics to remote servers, which can be accessed via its DataMapper platform. Moreover the drone sensors are fully customisable. Depending on your needs, you can buy extra sensors like Lidar and just plug it in. Sounds cool?


That’s not all. The PrecisionHawk software platform, DataMapper, is used for storing, processing and analysing remote sensing data features a really unique thing – a marketplace where a user can buy and sell your remote sensing algorithms. It is one of the first places where a user can easily commercialize it’s analysis tools and developments. But this is not the only area where the company is taking the approach to create an aerial information ecosystem. In early 2015, PrecisionHawk acquired TerraServer – a popular web portal to buy satellite images. In the future using TerraServer technology you will be able not only to buy satellite imagery, but order drone services from PrecisionHawk and other companies to get a higher-resolution picture of your desired location.


But building the end-to-end drone platform is just a beginning. In 2014 PrecisionHawk raised $11m in seed funding with the aim to go beyond being just an outstanding drone start-up. The company developed the first, automated air traffic control system for drones calledLATAS (Low Altitude Traffic and Airspace Safety) to help solve the safety issue presented when integrating drones into the airspace with competing obstacles.

The existing air traffic control system almost fully relies on ground radars. It works well with regular aircrafts, but small drones, flying at low altitudes are almost impossible to be detected. Besides, any system of human operators could not possibly scale to accommodate the millions of drones expected in years to come. LATAS on the other hand uses cellular and satellites technologies to manage millions of simultaneous connections between drones and other ground and air obstacles. By relaying on existing infrastructure the platform has the ability to scale and to accommodate the millions of drones expected in years to come.

The aim of the project is to safely integrate drones into the national airspace, and it is being tested together with United State’s FAA under the Pathfinder program.

From PrecisionHawk perspective LATAS is a strategic project as the safety requirements are still a key barrier for the industry. This doesn’t stop the company to expand from agricultural data collection business to new industries including construction, insurance and energy among other. Today PrecisionHawk’s client base includes several Fortune 500 companies in the US, Europe and Asia. Not to shabby.

“A million-dollar idea” for a start-up needs to have a clear vision which either solves an existing problem or generates a new desire. PrecisionHawk is a model example of that sort of thinking. The company’s founders had a clear vision and found a proper people to make it happen. Today PrecisionHawk is one of the industry leaders and it sets standards for everyone else.

ArcGIS Pro: An honest review


By 
Sunbeam Rahman

It’s been a while since ESRI announced ArcGIS Pro, a clean and revamped version of the ArcGIS Desktop. After a long exhaustive wait for a proper 64-bit geoprocessing and mapping environment ESRI has finally introduced something completely modified out of the scratch. This new version has a lot of new and interesting feature – can visualize, edit, and perform analysis in both 2D and 3D, it’s multithreaded and support 64-bit processing, new set of symbols, tools, workflows in a completely new user interface. There is a lot of excitements in everywhere for this new application.

So I decided to download the trial version of ArcGIS Pro 1.1 and have a look.

ArcGIS Pro: First impression
ESRI lets you register for a trial license of ArcGIS Pro for 60 days along with few essential extension. You will get the link of the trial download page and the ArcGIS Online account at your confirmation email. Once inside the ArcGIS Online account, you will have to set the privilege for the license type and extensions. Installing the application is quite straightforward, use the same username and password to start ArcGIS Pro.


We don’t want the program to login to the account and check for license in each startup. In Project menu, under Licensing select Authorize ArcGIS Pro to work offline. ArcGIS Pro has some difficulty with any preinstalled Python, so if you already have a python installed disable your PYTHONPATH for the time being. At this stage you will meet a window to create and edit map projects. I decided to create a Map.aptx called MyProject. Throughout this demonstration you will meet a lot of new file types and workflows like this.


ArcGIS Pro is a 64-bit software, no support for 32-bit PCs. ESRI wanted to introduce a lot of new workflow mechanism and toolchain activities which is different in ArcGIS Desktop. ‘ArcMap Document’ is now ‘Project’, ‘toolbox’ is ‘geoprocessing’, ‘table of content’ and ‘attribute table’ both lost ‘table’ from their names. The ‘content’ window can list features by their snapping status and label class. Moreover, both DirectX and OpenGL options are available for display rendering. You have the freedom to change this interface completely. But before that you will need some time to find all the useful features, and there is no global search option to help you out. A side by side comparison of all these new tools can be found here.


Some of the smallest and most essential utilities now has something new. The snapping toolbar has three more option – the intersection snapping, midpoint snapping and tangent snapping. The measurement tool looks better now.


The layer context menu has most of the useful options.


The new ‘Attribute table’ has a new look and feel.


The ‘Calculate geometry’ window is now a geoprocessing tool. The ‘Definition query’ has also improved.


The ‘Geoprocessing tools’ aka ‘Toolbox’ lists all recently used ones under favorite tab. The ‘Analysis gallery’ is as good as ‘Favorites’. I couldn’t find two of the most useful toolbox options – batch and debug. The ‘Task’ tool can be way around.

Starting a “GIS job”
Projects are a new way of organizing everything related to your map. The Projects (.aprx) lets you start your work in blank or with preinstalled templates. ArcGIS Pro can import your .mxd, .sdx and .3dd files and converts them to its own format. So do not expect your .mxd’s will function without any glitch, besides Python 3 is in action. Projects can even be shared like Map Packages (.mpk).


The ‘Symbology’ is no longer attached to the context menu. ‘Colorbrewer’ is now a part of symbology color scheme. You have all the essential symbology options available, but not the styles as it is in ArcGIS Desktop. The ‘graduated symbol’ in my pc crashed sometime. I couldn’t find the chart option. Thelabeling toolbar tried hard to home all the familiar choices in one place. You have a truck-load of fonts, but limited font styles. I was hoping not only for a prettier but also an intelligent labeling system.


Editing and geoprocessing

Edit whenever you like, no starting and stopping editing (which may cause accidental edit, so be careful). The small ‘editing status’ utility will help you to identify any edit time complexities. Templates can be a very powerful tool. The floating ‘tool feedback’ does its work. I couldn’t locate the advanced editing features (ie. COGO, Percel editing, Topology etc).


The geoprocessing capability has been the crown jewel of ArcGIS Desktop since its beginning. It’s the simplicity and robustness of the ‘Arc toolbox’ which made it the number one choice of all the GIS professionals for decades. In ArcGIS Pro, these tools remained in their boxes with very little changes. The tools can now dock together and ‘actually’ show progress bar. The geoprocessing history shows all the messages, errors and statuses in one place.


Here is list of all the tools those are currently not available. As mentioned before, the ‘Task’ feature can work instead of batch option.

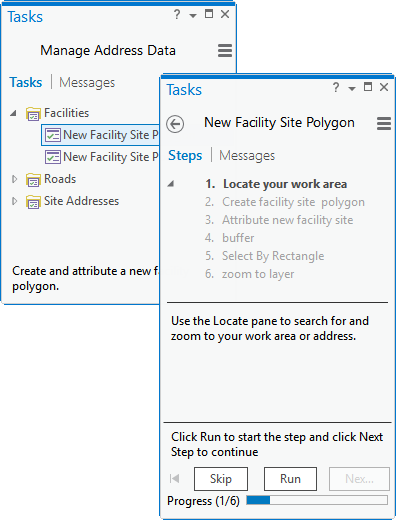
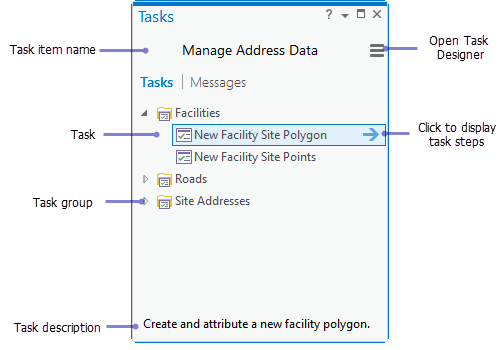
What is task? A task is a set of preconfigured steps that guide you and others through a workflow or business process. A task can be used to implement a best-practice workflow, improve the efficiency of a workflow, or create a series of interactive tutorial steps. – as described by the website. Tasks are easy to create and can also be shared. It can be used to create an automated workflow to work for similar geoprocessing request which operates and manages different other processes or groups.


This is a very promising addition, I will look forward for more.

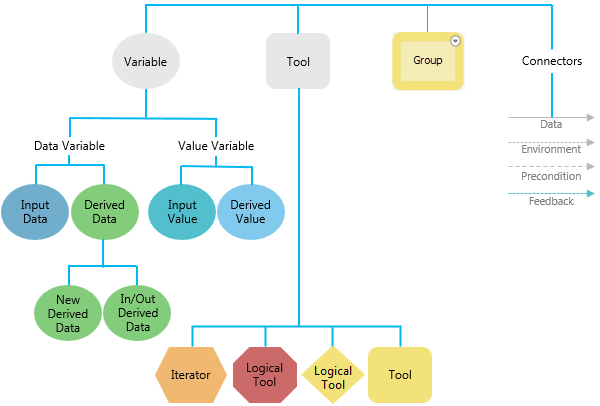
The ‘Modelbuilder’ has its charm in a separate pane. The ‘merge branches’ can merge multiple logical branches into single output. The color scheme changed a bit.


The Python scripting functionality is one of the most powerful extension of ArcGIS family. In ArcGIS Pro the Python windows has a lot of new feature.


The scripts are not only has autocomplete feature but also show helpful tool tips. Any geoprocessing that has run on Python window will show up in the current project’s Geoprocessing history. Script is taking too long to run – hit the cross to stop that immediately.


To make the operation breeze the Python window works with any file, tools and layers by simply dragging and dropping them inside the window.


Working with raster data has found some new functionality since ArcGIS Desktop 10. Part of this process ArcGIS Pro has all the raster geoprocessing tools in a new window.


Other options are distributed is many other windows but remain almost same. Raster functionalities of ArcGIS Pro are not something most of us should get eager about when programs like GRASS and Monteverdi has more tools than this and are absolutely free.

Layout making
The layout making workflow in ArcGIS Pro doesn’t seem to be much organized. Besides there is currently no option to add grids to the layout. In ArcGIS Desktop layers are automatically added to a map frame, here you need to specify a Map frame which doesn’t seem much intuitive. The north-arrow and scale bars are as usual, so does the legend. The maps and layout styles now a days changed a lot, the scale bars now have multiple units, legends are more stylish. Even though ArcGIS Pro is a mapping suit of 2015, it seems to have styles from 90’s. But there is something new, dynamic texts now can use information directly from metadata.


The individual elements now snap with each other as interactive layout tool. The ‘add guides’ window can add multiple guides at once depending on the orientation and placement. The map frame itself doesn’t have to be rectangular, it can be of any size and shape.


When you finish decorating your map, go to Share > Layout to export. The export formats remained same, except the compressed SVG (.svgz) and TGA is new, AI is gone (which you may not need when you already have .EPS). Most of the format lack some of their options compared with ArcGIS Desktop. All of them have a same option – ‘clip to graphics extent’, a familiar option which can be found in Adobe Illustrator. The default output name is surprisingly “ArcGIS.jpg” which should be “name_of_the_project.jpg”. I never understood why the DPI has to go below 100 because that creates a crappy output. Why not use a ‘quality’ slider saying ‘best’ to ‘smallest’ and adjust the DPI with the screen resolution just like Adobe Illustrator do.

Conclusion
Maybe I am not the right person to judge an application like ArcGIS Pro from a GIS powerhouse like ESRI who has been feasting on its lions share of the overall geospatial market for decades. But let me pick few things as I walk through with this new software and have them listed before it jeopardize my head.

Good things

  • The first good thing about this new software is that it is not ArcGIS desktop. ArcGIS Desktop somehow messed up in so many level that we should give up hoping for more fix
  • ArcGIS Pro is finally a cutting edge technology that works with both 2D and 3D. It takes advantage of latest multi-threaded processors and RAMs. It can also work with advanced GPUs to accelerate its 3D rendering capability
  • The project-based mapping workflow, the familiar ribbon-based user interface, the task and templates will help users of many other field to understand and communicate with each other
  • Eliminating a lot of edit-time and layout-time complexities shows that ESRI really hears what their customers use to say. For example, autocomplete polygon option now doesn’t depend on the double-click from the user to finish, it has its own finish button. This helps people with tablets a lot. There are a lot of similar complications been taken care of; so does many unnecessary options, exotic styles and commands with self-conflicting behavior.
  • I really liked the Python scripting environment. The geoprocessing windows took care of all the floating toolbars. The raster processing has found some new functionality. The users have more control over the user interface, geoprocessing capabilities and the project workflows.
  • Bad things
  • The user interface is fascinatingly dull! I would expect a darker interface for the people who work longer in front of the computer. (For example, Microsoft, the inventor of the ribbon interface themselves are switching to darker interface because they just look really good)
  • Still more to do to resolve conflicts among multiple Python environments under same workstation. Even if Python in ‘sandboxed’ inside the application (bin folder), user should get access to it and install libraries they want.
  • The biggest advertisement of ArcGIS Pro seem to be its ability of using its Large Address Aware processing engine. But in reality there are very little option to take advantage of this capability. For example, the geoprocessing tools can use more than 4 gigabyte memory, but no one sees how they are doing this. Are they taking single channel or multiple. How about running multiple tools in parallel.
  • The worst thing is actually the essential part of the application – the layout making functionality. The tool and options for layout making, map frame, adding symbols, elements and exporting to the final output seem to have spread across several panes. The steps for the final output gained complexity and sometime sluggish behavior.

The verdict
No wonder ArcGIS Pro is built on experience from a range of products which has been successful for a many good year, but the application itself is still a new born. Even if the product looks promising but it still feels underdeveloped and sometime unfinished. I understand the excitement, but let me suggest to hold your patience for a few more year. The ArcGIS Pro is good, but it can be better. There must be a balance between the functionalities and the demands. ESRI has taken a bold move, let them finish their journey.

About author
Sunbeam Rahman is self-inspired dream-guided GIS analyst who have spent most of his lifetime trying to decipher all the geospatial problems in the world, but couldn't solve one. Sunbeam had his masters with a major of 'Geography and Environment' and later joined a non-profit research NGO in Dhaka, Bangladesh. Sunbeam spends most of his time either in his office snoring or at home watching movies, cuddling with his cat, or doing bullshit like blogging.


Source: Club GIS

Κυριακή 20 Δεκεμβρίου 2015

How to Download Sentinel Satellite Data for Free


Download Sentinel-1 and Sentinel-2 Satellite Data
If you want to download Sentinel satellite data, then you’ve come to the right place.


One of the most exciting developments in remote sensing at this time is the European Space Agency’s Copernicus Programme.

Copernicus’ six Sentinel satellites collects comprehensive pictures of our land, ocean, emergency response, atmosphere, security and climate change to understand the health of our planet.

Until very recently, this data has become available to the public at no cost

Today, we show you step-by-step how to download Sentinel satellite data:


Sentinels Scientific Data Hub


In 2014-15, Sentinel-1 and Sentinel-2A were successfully launched from Europe’s Spaceport in French Guiana.

One Sentinel scene after the other, data has been rolling out on a user interface called the Sentinels Scientific Data Hub.

It’s now available for the public to access.

But you will have to hop through a couple of hoops before you can get your fingers on it.

Follow these steps to download free Sentinel satellite data:


Step 1: Create a User Account
Go to Sentinels Scientific Data Hub.

In the top-right of the webmap, click the SIGN UP button.

Insert valid entries for your name, email and location. Click register. Validate your email.

With a few clicks of the mouse, you’ve gain access to ESA’s Sentinel data.

Sign Up Sentinel

Step 2: Select Your Area of Interest
Where is your study area?

Using the SEARCH CRITERIA text box in the top-left, type in your area of interest.

In our example, we’ve typed Germany. Click Enter twice.

From here your search will yield results for all the Sentinel satellite data available.

Sentinel-1 (Synthetic Aperture Radar C-Band) swaths are depicted in red. Sentinel-2 (multispectral data) swaths are depicted in green.

Read More: What’s the difference between active and passive sensors?

Search Criteria Sentinel

Step 3: Download Sentinel Data
Now, that we have our user account created with our study area defined – all we have to do is sift through the results and download our chosen Sentinel data.

As we are working with large data sets, you will have to be patient with download speeds. It’s easy for the server to timeout during the download.

Select the product you want to download. S1A is Sentinel-1A. S2A is Sentinel-2A.

Below the product thumbnail that has the download URL. This is what you want to clip in order to download your chosen Sentinel data.


What’s Next?
After you download Sentinel satellite data, chances are that you are going to want to display it in the visible spectrum. This is exactly how our eyes see objects around us.

Each image is separated by their respective spectral band. See our table below for the spectral bands of Sentinel 2. Sentinel 2B will be identical to Sentinel 2A.

If you want to combine the red, green and blue channels as composite bands (such as Google Earth imagery) – read our composite bands tutorial.

…Or maybe you’d like to perform an NDVI analysis in ArcGIS or an image classification.

You now have free satellite data from Sentinel to help you.


What are the Spectral Bands of Sentinel 2A and 2B?
We’ve listed below, the spectral and spatial resolution of Sentinel 2A. There are 13 bands in total. Four spectral bands have a 10 meter resolution. Six bands have a 20 meter resolution. And the remaining 3 have a spatial resolution of 60 meters.

Here are the spectral band details for Sentinel 2A:


Source: SENTINEL-2 Spatial Resolution

Each single satellite revisit time is 10 days. Because there are two satellites (Sentinel 2A and 2B), this means it has a combined constellation revisit of 5 days.

Source: GIS Geography

How the new drone regulations will influence the skies?


By Thomas Foster


New drone regulation
As it is described in another article, FAA (Federal Aviation Administration) recently enforced mandatory registration of drones for all drone owners. Everyone is bound to register a drone or else you have to pay a fine. This law however, was not a surprise. FAA tried to enforce similar law few years ago and they also had a goal to enforce registration before the end of 2015. Many drone enthusiasts and people in the industry were against that.

Reasons for new law
The main reason that a new law was enforced is safety. There are a lot of individual drone owners who fly in forbidden areas and that fly dangerously. Flying dangerously is a problem if you pose threat to other people. Many new flyers are not experienced and then they fly drones in towns. Further concern is that drones in the sky interfere with other flying vehicles. Although it is already forbidden to fly in some areas where accidents might happen, many drone operators still do that. And regulators hope that with registration it will be easier to track them and also it will discourage them to fly in such areas. Security is the main concern of the regulators.


The other concerns are privacy concerns. When a person makes a footage, it can post it online without any restriction as long as it does not earn money with it. In case it earns money with the video or photography, it needs the consent of the owners of the land that was on the video/photo or of the people who are featured. Here there are still many gray areas of the law. With drone registrations they hope that amount of footage that is released in the public will be smaller.

Areas to avoid
Drones are very useful because you can fly them in the places that are otherwise unreachable or it is very hard to make footage from there. Alternative to aerial footage with quadcopter is usually footage made by helicopter. But helicopter has its minuses. It is expensive, big, loud and therefore it is hard to reach certain spots with it. So drones are great because they can reach almost any spot. However, the danger is that the pilot will not fly well (since there are no licenses for drone flying) or that it will hit a plane or helicopter or some other flying object. To eliminate that, drone flyers must follow the following rules (it was like that already before the registration was mandatory).

  • They must fly below 400 feet.
  • Keep the drone in sight.
  • Avoid other aircrafts in the air.
  • You are not allowed to fly within 5 miles or closer of an airport.
  • You are not allowed to fly near people or stadiums
  • You are not allowed to fly a drone that weighs more than 55 lbs (in case you are using it for personal usage)

There are also other areas to avoid besides those already listed above. It is forbidden to fly in national parks, military zones and special areas which are marked by the government. There is a whole map where you can and cannot fly available here. Besides listed rules, it is necessary to use also common sense about what you can or cannot do with drones when you are flying.


Drones must fly away from other aircrafts. On the picture: Drone under the airplane.


Who will be hit with the drone law?
The question regarding the law is if it will harm anyone. To aerial photographers and videographers that are trying to get some special footage, it should not make a difference as long as they do it on a legal way. There were many photographers who often flew drones in national parks without the allowance of the proper authorities. Those will be now discouraged. Most drone enthusiasts will probably also find no problems with registering. Registrations must be done after the purchase. So some people might be lazy and will not go and register a drone in case they do not think they will get their drone inspected. FAA decided to ask people to register it and it did not give an option to register a drone at the moment of purchase. The only one who might actually get hit are drone sellers and manufacturers because their sales might decrease. However the true effect of the new law on the sales of drones is hard to determine.

Other ways how they might regulate in the future
Drone industry will get even more regulated. That is because the industry is growing and there are more drone users every day. So the safety concerns will be even bigger. Currently the laws are not that strict because not many people are flying drones, it is hard to learn to fly them and in general many people just do not know about them yet. However, these things are changing with new models which suit the final customer better. With this, more people who are not experienced are using drones for their applications. There are also more accidents every day as well as lawsuits. Those things are leading the regulators to make the rules clearer. Small industry can be self-regulated; but big one cannot.

What is the future of drones?

The future of the drones and drone usage is vague. Some people believe that the government rules will get stricter and that those rules will reduce the drone usage. The government might also see a threat to security in drones since they are flying objects with which you can do literally anything.

But some people also say that the industry will expand and that drones might be the new industrial revolution. Although this might be exaggerated, drones could play a more important role in our future. Besides personal usage, also film makers, marketers and journalists are using them nowadays. Government and shops are also finding them useful – government for control and for various operations (firemen sometimes use them) and shops for delivery.


There are two other branches of drones. Agriculture drones, used for agriculture are also gaining popularity. And here are also military drones, which are more evolved than commercial ones and are used in military operations where they replace humans. That is certainly a useful thing for military as this reduces casualties. But there is a fear which I already described – that military technology might be transferred to commercial drones. That might kill the whole commercial drone usage.

Credits for this article go to Thomas Foster, a quadcopter enthusiast and an owner of the website that compares quadcopters and features various guides. He is also an observer of changes in drone industry. You can follow him on Twitter.

Σάββατο 19 Δεκεμβρίου 2015

Ecological Footprints


“There is no planet B”. This slogan has become widely mentioned recently in relation to COP21, the United Nations conference on climate change in Paris. The slogan highlights that the debate about climate change relates to much more than simply a changing climate. The underlying processes have a lot to do with our lifestyles and the related patterns of consumption and waste which cause severe damages to the environment (including the global climate). Carbon emissions are therefore one major trigger of climate change, but are also an effect of our unsustainable ways of life. The ecological footprint shown in the following map is a measure that looks at the impact that humanity has on our planet:


Humanity’s demand for goods and services created from our planet’s resources have for a long time exceeded what Earth’s ecosystems are capable of renewing. It is estimated that we exceeded this limit in 1970. According to calculations from the Global Footprint Network, it is now in the first half of August that we go into ecological debt, on a day known as Earth Overshoot Day.


The ecological footprint calculates the amount of land required to sustain a country’s consumption patterns, including “the land required to provide the renewable resources people use (most importantly food and wood products), the area occupied by infrastructure, and the area required to absorb CO2 emissions” (quoted from the Happy Planet Index Report). The measure also takes imports into account, so that the negative environmental impact of products is considered where these are consumed rather than where they are produced. The ecological footprint is expressed in global hectares which represent a hectare of land with average productive biocapacity.
There are various approaches to calculating this measure and to come to conclusions about the impact and implications of this concept. The Global Footprint Network estimates that taking the current global population into account, each person can sustainably use 1.8 global hectares for a one-planet living, while the humanity currently extracts resources much faster than they can be regenerated. At the current levels of consumption (and waste), humankind would need more then 1.5 Earth-like planets to sustain this standard of living.
While not being without criticism, the Ecological Footprint is one of the most comprehensive assessments of the global environmental impact that can be estimated on a global scale for all nations. This gridded cartogram visualises data published in the most recent Happy Planet Index which uses the Ecological Footprint as one of its indicators. The map combines each country’s average per capita ecological footprint with the global population distribution on a gridded basis. Each grid cell therefore is resized according to the total amount of land used by the population in that space according to their demand on nature. An area twice as large as another uses up twice as much global hectares. In addition, a traffic-light colour scheme shows the overall environmental impact of each country turned into numbers of planets that were needed if the world as a whole was to live such a lifestyle.

The considerable differences between the nations become strikingly visible in this image. While much of the wealthy world especially in Europe and North America lives rather unsustainable lives, the still growing populations on the African continent but also in the world’s second largest country of India still live within Earth’s environmental means. What example is the rich world providing these future generations for the future of our planet?

Post scriptum: Checking my very own ecological footprint via WWF’s Online Footprint Calculator I have to plead guilty to contributing my part to this map. Sustainable futures are as much a challenge for society as a whole as they are for each individual populating this fragile planet.