Εμφάνιση αναρτήσεων με ετικέτα Germany. Εμφάνιση όλων των αναρτήσεων

Τρίτη 27 Οκτωβρίου 2015

The Growth and Decline of Urban Agglomerations in Germany


Innovative maps that illustrate the most recent socio-demographic urban changes in the major city urban agglomerations in Germany have very recently been produced in a joint project of the School of Geography and the Environment at the University of Oxford and the Research Institute for Regional and Urban Development Dortmund (Germany).
The Research Institute for Regional and Urban Development (Institut für Landes und Stadtentwicklungsforschung, ILS) investigates new social processes, especially those involving urbanisation in Germany and Europe. This includes economic, social and structural processes that are compared and monitored over time to gain a better understanding of the underlying developments. Testing state-of-the-art visualisation techniques are a significant part of this effort. This was the focus of a collaboration between researchers of the University of Oxford and the ILS Dortmund which resulted in the development of a series of highly effective maps called “cartograms” that provide new insights in the changing geographies of city regions in Germany.

The method used in the research creates gridded cartograms in which equally-sized grid cells are resized according to number of people in any area. The resulting map looks as if the reader has placed a magnifying glass on the most densely populated regions while sparsely populated areas are much smaller than they appear on a land area map. This allows additional spatial information such as socio-demographic data to be shown in their relation to population. Using such visualisations dynamic changes, such as shifting populations, can be analysed in their spatial as well as their human context.


Approximately half the population of Germany lives in the 30 major urban German agglomerations, such as Berlin, Hamburg, Munich (München), and Cologne (Köln) but also in smaller cities including Münster, Freiburg, Leipzig, and Dresden. The gridded cartogram helps to understand the demographic processes and development that occurred there in recent years, revealing some distinct trends of re-urbanisation in some of the most densely populated areas.
Examination of the average annual change in the populations of the selected urban agglomerations highlights the regional differences in these trends. Contrary to the national population decline, which is predicted to continue, 26 out of the 30 major agglomerations show population growth between 2008 and 2013. In 25 of these areas population growth in the city centre is even higher than in its suburban area. This can be seen as evidence of a very recent trend of re-urbanisation in these places.

One particularly notable trend is the dynamics in smaller cities such as Freiburg and Münster, as well as Dresden and Leipzig in east Germany. In addition to high rates of re-urbanisation, the suburban areas often have stagnating or even declining populations.
The Ruhr area agglomerations are distinctively different from the other areas described in the overall summary of trends. The stagnating populations in the centres of Dortmund and Essen are complemented by considerably declining populations in their surrounding areas.
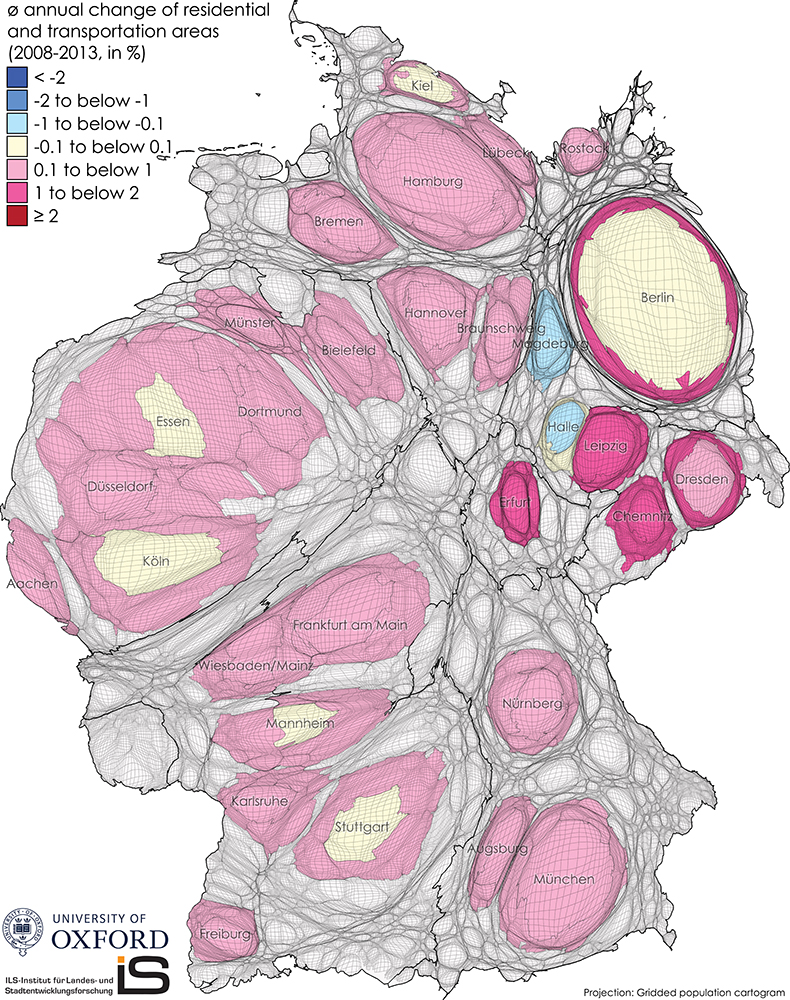
Two cartograms depicting growth and decline have been produced as separate maps. These reveal, population decline in the settlements in the Ruhr area that is larger than in all other urban agglomerations put together. Growth, in contrast, is spatially spread much more evenly.
Amongst the influencing factors or growth and decline are developments in social structures, employment as well as changes in land development in these regions. How these factors are interconnected and influence each other is part of further research within this project that aims at establishing a long-term geomonitoring of these regions in order to better understand these new forms of urbanisation in Germany that are currently only just beginning to emerge.

Average annual change of employees
between 2008 and 2013


Average annual change of benefit recipients
between 2008 and 2013


Average annual change of residential and transportation areas
between 2008 and 2013

Average annual change of commercial areas and open spaces
between 2008 and 2013

The content on this page has been created by Benjamin Hennig and Stefan Kaup with the support of Tanja Ernst of ILS – Research Institute for Regional and Urban Development(Dortmund, Germany) using data from the forthcoming edition of the annual geomonitoring report of urban agglomerations in Germany. Please contact me for further details on the terms of use.

Τετάρτη 14 Οκτωβρίου 2015

Wireless sensor network monitors microclimate in the forest


A wireless sensor network records data such as soil and leaf humidity, as well as air temperature.
Credit: Image courtesy of Fraunhofer-Gesellschaft


During a forest monitoring operation, forestry scientists measure various environmental values. This is how they obtain indications about how the forests are changing and what can be done to preserve them. However, installing and maintaining the wired measuring stations is complex: Researchers developed a wireless alternative.


What effect does climate change have on our local forests? What types of trees will be suitable for which geographic location? And how great is the pollution level here? Forestry scientists are conducting "forest monitoring" procedures: They continuously record parameters such as soil humidity or pollutant penetration at permanently installed monitoring stations. The results of such examinations contribute to maintaining the ecological stability of the forests over the long term. The problem: Not only are the wired measuring devices complex to install and maintain, they also hinder silvicultural work in the forest.

In the future, technologies from the Fraunhofer Institute for Microelectronic Circuits and Systems IMS could enable differentiated analysis without any bothersome cables. Scientist from the institute in Duisburg installed a new type of system for microclimatic monitoring on the grounds of the Northwest German Forestry Testing Facility in Göttingen, Germany. "We are using a wireless sensor network so we can measure relevant parameters within an area at many sites simultaneously," explains Hans-Christian Müller, group manager at the IMS. This way, we receive a very detailed picture about the environmental conditions on site, without much installation effort. Depending on which values they are to measure -- for example, soil moisture content, air temperature or the moisture in the leaves -- different sensor nodes are inserted into the soil or affixed to branches. If required, the measuring positions can be changed without much effort. The intelligent mini-computers automatically form a network and control the transmission of measurement data within this network. The results are transmitted by cellular radio to a central tree stock database. To facilitate this, a mobile cellular modem is connected directly to the sensor network.

Providing power to the sensor nodes poses a particular challenge. Mounting solar cells to the sensors -- a favored solution in other agrarian and forestry applications -- is not an option due to the low penetration of sunlight under the leafy canopy of the trees. That's why, to date, there has been no alternative to batteries that have to be replaced regularly. Researchers, however, managed to significantly increase battery life, keeping maintenance requirements within reasonable limits: "We adapted the software design accordingly and now have operating times of 12 months," says Müller. A software solution integrated into the sensors ensures that the radio nodes are for the most part in an energy-saving sleep mode. They are active only during the measurement and data transmission process. The measurement intervals can be set to be variable. Parameters that change slowly such assoil moisture need not be measured as often as air temperature, for example, which is subject to larger variations. Since data transmission requires the most energy, the measurement values are calculated as early as the sensor node. This reduces the data volume.

The new technology is already in use in Göttingen as part of the joint project "Smart Forest." The project aims to optimize forestry processes with the aid of microelectronic components. The researchers from IZM will be introducing their results on the "Smart Forests" as well as other developments on the industrial application of wireless sensor networks at the Messe Sensor + Test tradeshow from June 7 -- 9 in Nuremberg, Germany.


Story Source:

The above post is reprinted from materials provided by Fraunhofer-Gesellschaft. Note: Materials may be edited for content and length.

Article source: Science Daily

Πέμπτη 1 Οκτωβρίου 2015

Asylum seekers in Europe


2,500 people are believed to have died or gone missing on their way to Europe this year already, according to estimates by UNHCR. But it was the image of a young boy found dead on the shores of Turkey which changed the tone in the debate about the ongoing refugee crisis in Europe. While the response to the crisis varies strongly, Campaign groups are calling for a European-wide approach to the crisis. While Germany suspendedthe Dublin regulation to allow regugees into the country and claim asylum regardless of where they entered the European Union, the country also calls for a more equitable system of sharing refugees across the EU similar to Germany’s domestic approach of distributing refugees.
The following cartogram shows the current situation in Europe using Eurostat’s latest statistics about the number of asylum applicants in each country. The data covers the first half of 2015 (January to June) and adds up to 417,430 officially recorded claims in that period in the EU member states. The following map also includes those European countries which are not member of the European Union but part of the Schengen area and it shows each country resized according to the absolute number of asylum applications in that country from January to June 2015:


Also included in this cartogram is a reference map that shows the population distribution in Europe – which differs significantly from the main map. In 2014, Germany had the largest absolute number of asylum seekers (as also shown in the map below) in Europe (more than 200,000 compared to over 80,000 of second-ranked Sweden), while the relative distribution saw Sweden on top with 8,365 asylum applicants per 1 million population (Germany: 2,513), Hungary coming second with 4,337 asylum applicants per 1 million population not least due to its geographic location on some of the most frequently usedmigration routes into Europe. Other populous countries saw much lower figures, such as 972 asylum applicants per 1 million population in France and 494 asylum applicants per 1 million population in the UK.
Last year EU countries offered asylum to 184,665 refugees, while according to Eurostatmore than 570,000 migrants applied for asylum. This is a map the situation in 2014, showing the distribution of asylum applicants in Europe:


To put these numbers into perspective, the number of refugees heading for Europe is small compared to the global picture that UNHCR published in its Global refugee trendsearlier this year: Around the world, almost 60 million have been displaced by conflict and persecution last year. Nearly 20 million of them are refugees. Lebanon alone houses far more than a million Syrian refugees, a number that is higher than the whole number of refugees expected to arrive in all European nations put together.
While European leaders fail to find a joint – and humane – approach, citizen have started to take action, such as an internet platform dubbed as AirBNB for refugees in Germanyand a Facebook campaign in Iceland where “more than 11,000 families in Iceland have offered to open their homes to Syrian refugees in a bid to raise the government’s cap of just 50 asylum seekers a year”.

More migration-related maps from this website can be found here:
  • Global refugee trends: showing countries or origin and destination as documented in the most recent UNHCR report
  • Migrants at Sea: A look at where Mediterranean refugees arrived in Europe between 2006 and 2014
  • Displaced lifes: Internally displaced people

The colours in the above maps are using a colour scheme developed for the Social Atlas of Europe. Each country shown has a unique colour which allows it to be identified in the differently distorted maps. Furthermore, all countries in these maps are shaded using a rainbow colour scheme, starting with shades of dark red to demarcate the countries with the most recent association with the EU and moving through to a shade of violet for the oldest member states.


The Social Atlas of Europe
by Dimitris Ballas, Danny Dorling, Benjamin Hennig

Published by Policy Press
[Oder your copy here]

The content on this page has been created by Benjamin Hennig using data by Eurostat. Please contact me for further details on the terms of use.


Urban change in Germany


This is a German-language poster contribution looking at processes of change in the major urban agglomerations in Germany and novel ways of visualising these using cartogram techniques. The poster was prepared as a contribution to the German Geography Congress (Deutscher Kongress für Geographie) in Berlin (Oxtober 1-6):


An English summary for this poster will follow soon on this page. Meanwhile, here is the German text:

Alternative Visualisierungsmethoden soziodemographischer Daten:
Urbane Veränderungsprozesse in Stadtregionen Deutschlands

Das Geomonitoring-Projekt des Instituts für Landes- und Stadtentwicklungsforschung (ILS) befasst sich mit „neuen Urbanisierungsprozessen“ in Deutschland. Dabei werden Fragen ökonomischer, sozialer und baulicher Prozesse untersucht und auf regionaler Ebene in ausgewählten Stadtregionen vergleichend betrachtet, um mittelfristig die stattfindenden Veränderungsprozesse besser zu verstehen.
Bestandteil eines verbesserten Verständnisses ist dabei auch die Anwendung neuer Visualisierungsmethoden, die die stattfindenden Prozesse anders darstellen und so zu einem neuen Verständnis beitragen können. Dieser Beitrag gibt eine Einführung in diese Methoden, die in Zusammenarbeit mit dem Worldmapper-Projekt an der University of Oxford (Großbritannien) entwickelt wurden.
Angelehnt an die Analyseeinheiten des Bundesinstituts für Bau-, Stadt- und Raumforschung (BBSR) stellen die untersuchten Stadtregionen (Karte 1) die verdichteten und funktional zusammenhängenden Stadträume Deutschlands dar. In ihnen leben circa 50% der Gesamtbevölkerung des Landes.

Als alternative Visualisierungsmethode kommen hier so genannte anamorphe kartographische Darstellungsmethoden zum Einsatz, die auch im deutschen Sprachgebrauch zunehmend als Kartogramme (engl. cartograms) bezeichnet werden. In einem Kartogramm wird die Geometrie einer konventionellen Karte auf Basis quantitativer Daten verzerrt, so dass die zugrundeliegenden Daten proportional die Ausgangsfläche verändern. In einer Weiterentwicklung dieser Methode, den Rasterkartogrammen (engl. gridded cartograms), stellen gleichmäßig verteilte Rasterzellen die Grundlage für die Verzerrung dar. Dabei bleiben die topologischen Bezüge des zugrundeliegenden geographischen Raumes erhalten. So können zusätzliche Dimensionen auf den verzerrten Karten in ihren korrekten räumlichen Relationen dargestellt werden.
Die Bevölkerungsrasterkartogrammdarstellung der Stadtregionen Deutschlands (Karte 2) verdeutlicht, wie diese – je nach Agglomerationsraum mit recht unterschiedlich ausgeprägten Unterschieden zwischen Kernstadt und Umland – die Siedlungsstrukturen in Deutschland prägen. Jede Rasterzelle wird hier proportional zu der in diesem Gebiet lebenden Bevölkerungszahl vergrößert bzw. verkleinert. Darauf lassen sich dann dynamische Veränderungen, wie zum Beispiel die durchschnittliche relative Veränderung der Bevölkerung zwischen 2008 und 2013, abbilden (Karte 3), die so in Bezug auf die Bevölkerungsdichte verständlicher werden. Die Kartentransformation wirkt hier wie eine Lupe auf die in herkömmlichen Karten in der Regel sehr klein dargestellten Verdichtungsräume, während die dünn besiedelten ländlichen Regionen auf eine minimale Größe reduziert werden.
Die absoluten Veränderungen über den Betrachtungszeitraum lassen sich auch in der traditionelleren Kartogrammdarstellung visualisieren, die eine Art kartographische Variante eines Kreissektorendiagramms darstellt. So lassen sich die Ausmaße von Schrumpfung (Karte 4a) und Wachstum (Karte 4b) in ihrer quantitativen Dimension direkt vergleichen – jeder Raum ist hierbei nur in jeweils einer der beiden Darstellungen vorhanden, um so die negativen bzw. positiven Veränderungen entsprechend zu quantifizieren. Zum besseren Verständnis wird hier das in der Rasterdarstellung verwendete Farbschema beibehalten, so dass sich die Karten für Wachstum und Schrumpfung direkt zuordnen lassen.

Betrachtet man die durchschnittliche jährliche Veränderung der Bevölkerungszahl in den ausgewählten Stadtregionen, zeigt sich im Vergleich zum Schrumpfungsszenario Gesamtdeutschlands ein positiveres Bild. In 26 von 30 Regionen lässt sich ein durchschnittliches Wachstum der Einwohnerzahlen erkennen. In 25 Räumen entwickelt sich dabei der stadtregionale Kern positiver als das Umland. Die bereits bevölkerungsreichen Regionen wie Berlin, München, Hamburg und Frankfurt (Main), die in der Kartogrammdarstellung deutlich gegenüber ihrer geographischen Lage hervortreten, wachsen sowohl im Kern als auch in ihrem Umland.
Bemerkenswert sind die Entwicklungen vergleichsweise kleiner Städte wie Freiburg oder Münster bzw. einiger ostdeutscher Städte wie Dresden oder Leipzig. Während die Kernstädte dieser Regionen die höchsten Wachstumsraten verzeichnen, fällt die Entwicklung des Umlandes hierbei besonders zurück bis hin zu Stagnation (Freiburg, Leipzig) und Schrumpfung (Münster, Dresden). Deutlich hebt sich die Entwicklung in den städtischen Agglomerationen des Ruhrgebiets von der übrigen ab. Stagnieren die Bevölkerungszahlen in den Kernen von Essen und Dortmund im betrachteten Zeitraum noch, so schrumpft der sie umgebende städtische Raum bereits beträchtlich.

Die Faktoren, welche diese angerissenen Entwicklungen beeinflussen, sind in der Entwicklung von sozialem Gefüge (Karte 5a) und Beschäftigung (Karte 5b), der Entwicklung der demographischen Gruppen und der Flächenentwicklung (Karten 6a und 6b) wie dem Angebot und der Nachfrage an Wohn- und Gewerberaum zu suchen. Die Faktoren wirken dabei aufeinander ein. Um die Hintergründe der Trends und Unterschiede in den Regionen aufzudecken, ist eine detaillierte Betrachtung jedes einzelnen Faktors sowie der Verschränkung der Einflüsse untereinander notwendig.

Das ILS-Geomonitoring leistet einen Beitrag zur Unterstützung dieser Auswertungen, indem Indikatoren und Zeitreihen entwickelt und Basisanalysen durchgeführt werden. Zur vertiefenden Analyse der hier angerissenen Entwicklungen wird in der kommenden Ausgabe des Jahrbuch Stadtregionen (2015/2016) das Monitoring Stadtregionen wieder aktuelle Trends der Bevölkerungs-, Beschäftigten-, Sozialraum- und Siedlungsentwicklung in ausgewählten städtischen Räumen aufzeigen. Dabei ist seit der letzten Ausgabe das Spektrum der Themen noch einmal geschärft worden. Die Entwicklung wird sich auf den Zeitraum der Jahre 2008 bis 2013 beziehen.

The content on this page has been created by Benjamin Hennig and Stefan Kaup with the support of Jutta Rönsch of ILS – Research Institute for Regional and Urban Development(Dortmund, Germany) using data from the forthcoming 2015 edition of the annualgeomonitoring report of urban agglomerations in Germany. Please contact me for further details on the terms of use.

Τετάρτη 23 Σεπτεμβρίου 2015

Satellite Masters Conference and Awards Ceremony

Explore cutting-edge space applications from 20 - 22 October 2015 in Berlin - After the great success last year, the second edition of the conference will showcase a unique portfolio of innovative applications based on satellite data and infrastructures.

The Satellite Masters Conference is much more than just a networking event: it is a unique marketplace for sharing ideas on space-based innovation and connecting with the world's leading network for downstream satellite business. The conferencewill feature an outstanding blend of sessions, solution soundbites, and roundtable discussions centred around leveraging satellite-derived data and other space solutions for business and society in the following fields: tackling global change with sustainable solutions, managing disasters and security with data from space, big data from space for business in the cloud, small satellites with a big impact on the new space economy, satellite services for European infrastructures, smart cities: sustainable living based on data from space.

The conference is geared toward all those looking to benefit from the emerging satellite applications market, including start-ups, SMEs, researchers, investors, institutional stakeholders, and industry entities.

The annual Awards Ceremony of Europe's major innovation competitions for space applications - the Copernicus Masters and the European Satellite Navigation Competition - will cap off the event. The most brilliant awardees will also present their business cases during the conference.

The Satellite Masters Conference and the Awards Ceremony will kick off with a high-level roundtable on the subject 'Space 4 Digital Business', opened by Dorothee Bär, State Secretary of the German Federal Ministry of Transport and Digital Infrastructure (BMVI). Don't miss the opportunity to join the discussion about the impact of space on the digital economy of Matthias Petschke, Director of European Satellite Navigation Programmes, European Commission (EC); Philippe Brunet, Director I - Space Policy, Copernicus and Defence, European Commission (EC); Carlo des Dorides, Executive Director of the European GNSS Agency (GSA); Prof Dr Johann-Dietrich Wörner, Director General of the European Space Agency (ESA); Dr Hubert Reile, Program Director Space Research and Technology at the German Aerospace Center (DLR); and Thorsten Dirks , President of Bitkom.

On 22 October, the European GNSS R&D Day will showcase success stories on research applications and instruments designed to support entrepreneurs.

The conference is organised by Anwendungszentrum GmbH Oberpfaffenhofen (AZO) in cooperation with the European GNSS Agency and will be hosted by the German Federal Ministry of Transport and Digital Infrastructure (BMVI) in Berlin from 20 - 22 October 2015.

Σάββατο 8 Αυγούστου 2015

GAF AG and Partners Monitor Changes at NATURA2000 Sites across Europe


As part of the Copernicus Land Monitoring Service’s local component, a European consortium headed by GAF AG is conducting a detailed assessment of land cover/land use changes at more than 750 European Natura2000 sites, on behalf of the European Environment Agency (EEA).

Semi-natural and natural grasslands are important European ecosystems that provide high biodiversity and a range of other environmental and societal functions. The intensification of agriculture and grassland management, land abandonment, drainage, shrub encroachment, afforestation, changing population structures and urbanisation are increasingly threatening these valuable natural communities. A series of European policies have therefore been created in order to safeguard such declining grassland biotopes. Pivotal in this context is Natura2000, which has established a network of protected areas including important (semi-)natural grasslands. However, even these protected grasslands are threatened by degradation and destruction.

For this reason, a team of experienced European service providers (GAF, INDRA, Metria and GeoVille) has been awarded a contract by the European Environment Agency to investigate land cover/land use developments and trends at a representative selection of Natura2000 sites and their immediate vicinity between the years 2006 and 2012. Based on 2.5m spatial resolution optical satellite imagery, the consortium will answer the question whether/in how far the Natura2000 network has been successful in halting the loss of (semi-)natural species-rich grasslands, or in improving the conservation status of degraded habitats. This will entail a detailed analysis of the specific pressures and threats being exerted by the observed land cover/land use changes, in order to draw conclusions on possible future developments on a European and regional scale.

This latest project in the Copernicus Land local component complements the other initiatives by providing a detailed zoom-in on ‘hot spots’ of biodiversity and human activity, e.g. the Riparian Zones and Urban Atlas. In the Natura2000 project, GAF is responsible for the overall project and quality management, as well as for conducting the very-high resolution land cover/land use mapping and change assessment for western and central Europe, most of Italy and parts of south-eastern Europe.


Example of abandoned semi-natural grassland in 
the Bavarian Alps, Germany (left); detailed land 
cover/land use (2012) around a Natura2000 site 
near Regensburg, Germany (right) 
Images: GAF AG 


About GAF AG

GAF AG is an e-Geos/Telespazio company based in Munich, Germany. It is a leading solutions provider with an international reputation as a skilled and reliable supplier of data, products and services in the fields of geo-information, satellite remote sensing, spatial IT and consulting for private and public clients. GAF is one of the most experienced European service providers in the EU/ESA Copernicus Programme and covers all the thematic domains: Land, Marine, Atmosphere, Climate Change, Emergency Management and Security. GAF also provides solutions in the sectors of natural resources management, water and environment, renewable resources, mining and geology. Over the past 29 years, GAF has been active in more than 100 countries throughout Europe, Africa, South America and Asia. Further information is available at www.gaf.de.

About EEA

The European Environment Agency (EEA) is a European Union public body seated in Copenhagen, Denmark. It supports the European Union in the development and implementation of environmental policy by providing relevant, reliable, targeted and timely information on the state of the environment and future prospects, as well as independent scientific knowledge and technical support. The European Commission’s Directorate General for Internal Market, Industry, Entrepreneurship and SMEs (DG GROW) entrusted EEA with coordinating the implementation of the Copernicus Land service’s continental (pan-European) and local components, as well as cross-cutting in situ coordination. Currently, the EEA has 33 member countries (the 28 Member States of the European Union, Iceland, Liechtenstein, Norway, Switzerland and Turkey) and 6 cooperating countries. Further information is available atwww.eea.europa.eu.

About Copernicus Land Monitoring

Copernicus, previously known as GMES (Global Monitoring for Environment and Security), is the European programme for establishing a European capacity for earth observation. The objective of its Land Monitoring service is to provide users in the field of the environment and other terrestrial applications with consistent and up-to-date information based on space data and other sources. It addresses a wide range of policies, such as environmental issues, regional development, agriculture, transport and energy, at the EU level, as well as European commitments to International Conventions. It consists of three main components: global, continental (pan-European) and local. Further information on the Copernicus Programme is available at www.copernicus.eu. Information on the Copernicus Land Monitoring service is available at land.copernicus.eu.

Contacts:
GAF AG

Daniela Miller

Arnulfstr.199, 80634 Munich

Tel. +49 89 12 15 28-0

Fax. +49 89 12 15 28-79

Email Contact

www.gaf.de