Κυριακή 25 Οκτωβρίου 2015

Map Projections: Flatten the Sphere


Why use map projections?
The best way to represent the Earth is with a globe. We live on one big blue marble that’s the shape of a sphere (or close to it)

But globes are hard to carry in your backpack, you can only see one side of the globe, it’s hard to measure distances and they’re just not as convenient as paper maps.

This is why we project globes on two-dimensional planes with map projections. For the GIS analyst to make use of points, lines and polygons, it is necessary to locate them in two dimensions.

But Earth’s surface cannot be represented on a plane without distortion. This is because the Earth is curved. So this means that every map projection will distort the Earth in some way.

Different map projections have different strengths and weaknesses. Today, we explore everything you need to know about map projections in GIS.


What is a Map Projection?


Map Projection Georeference

How do you take this relatively large sphere that we live on and project it on a two-dimensional plane?

Use map projections!

A map projection is a method by which the cartographer translates a sphere or globe into a two-dimensional representation.

A map projection systematically renders a 3D ellipsoid (or spheroid) of Earth to a 2D map surface.

Because 3D surfaces cannot be displayed perfectly in a two-dimensional space, some distortions can occur. Examples of map distortions are of conformality, distance, direction, scale, and area. Map distortions always result from map projections.

There are multiple ways to represent a sphere on a two-dimensional surface… Like Jason Davies popular Map Projection Transition Visualizer.

Every projection has strengths and weaknesses. It is up to the cartographer to determine what projection is most favorable for its purpose.

Peel an Orange: Transform 3D to 2D


Orange Peel Map Projection: Goode Homolosine

Imagine you have an orange (the fruit). You can pretend the orange is our three-dimensional Earth.

There’s no way to see all the sides of this orange any way you look at it.

When you peel the orange, flatten and stretch it on a table, you can begin to see all sides of the orange.

You’ve transformed a three-dimensional shape onto a two-dimensional plane.

Assumptions have to be made about the shape of the earth. The earth is an irregular shape though most map projections assume it to be a sphere or an ellipsoid.

Map Projections as Equations


Globe: New York to Tokyo

If you stared at a globe and wanted to know the shortest distance between New York and Tokyo, how would you do this?

Typically, you’d draw a straight line from start to end point. But how do you draw a straight line on a sphere?

First, you need some background on spatial referencing systems. Lines of latitude run parallel to the equator and describe north and south positions on Earth. Lines of longitude (meridians) are east and west directions.

Latitude and longitude lines form geographic grids on Earth. Every place on Earth has a geographic grid coordinate. For example, the North pole is located at 90° N, 0° W

Map projections are actually equations that transform the earth’s angular geographic coordinates (latitudes and longitudes) to XY Cartesian coordinates on a flat projected surface.

But the problem is:

When we try to take this world and project it onto a two-dimensional plane, there’s going to be distortion.

Let’s examine the developable surfaces and distortions for map projections.

Developable Surface Map Projections


Most map projections are based ondevelopable surfaces. A developable surface is the geometric shape that a map projection can be built on.

Cylinders, cones, planes… Map projections take these types of developable surface shapes and flattens it in a two-dimensional plane. Each surface is mathematically flattened based on those geometric shapes.

The Earth can use various types of developable surfaces to create some pretty interesting map projections as shown below:

Conic Projections use a cone to develop its surface on a plane. Meridians converge at a single point, which may or may not be the South or North pole. Area is distorted, while scale is mostly preserved. Distance at the bottom of the image suffers the most distortion.

Cylindrical Projections use a cylinder to develop a plane surface on a map. A cylinder is wrapped around the globe and unraveled on a flat surface. Cylindrical map projections can be equidistant, conformal and equal-area. Countries near the equator has truest relative positions while the view of the poles are most distorted.

Azimuthal (plane) Projections use a plane to develop a surface on a map. They are often tangent to the ellipsoid at one point. The projection center must be specified. Only half of the globe will be viewed with more distortion occuring at the four edges.

Gnomonic Projections use the center of the spheroid as the projection center.


Stereographic Projectionsare diametrically opposite to the tangent point.


Orthographic Projectionshas a projection center at infinity.


The most common map projections use developable surfaces. But some map projections do not. They are based on mathematical forms that aren’t cones, cylinders, planes or other three dimensional figures.

Some examples of map projections that don’t use developable surfaces are the Goode and Bonne projections.

Map Projection Examples
Through human history, maps have used a wide range of projections. Explorers used maps to accurately travel. The first known map originated in Greece and showed that the world was perceived to be cylindrical.

There are thousands of map projections that are in existence today!

Some map projections are useful for some things and other map projections are good for other things.

Two of the most common map projections used in North America are the Lambert conformal conic and the transverse Mercator.

Lambert Conformal Conic

North America: Lambert Conformal Conic
The Lambert Conformal Conic is derived from a cone intersecting the ellipsoid along two standard parallels. When you “unroll” the cone on a flat surface, this becomes the mathematically developed surface.

The most distortion occurs in the north-south directions. In general, distortion increases away from the standard parallels. For example, this map protection severely expands South America.

Universal Transverse Mercator

North America: Mercator
Universal Transverse Mercator (UTM) coordinate system is a standard set of map projections with a central meridian for each six-degree wide UTM zone. Even though Google maps used the Mercator projection because it preserves shape decently, and north is always up.

But Mercator map projections are really bad at preserving area. For most of us, the projection is common enough that it looks fine for us. In reality, Africa is huge on a globe. But Greenland appears to be as large as Africa, even though in reality it is only 1/14th the size. The Mercator puzzle gameillustrates this point.


Conclusion
Spatial referencing systems (latitude and longitude) are used to locate a feature on the Earth’s spheroid surface. The location of any point on Earth can be defined using latitudes and longitudes. These points are expressed in angular units such as degrees, minutes and seconds.

Most maps in a GIS are in two-dimensional form. To make use of these maps, a referencing systems that uses a pair of coordinates measured along axes at right angles to one another is required. To obtain a pair of coordinates, a graticule is placed on the map. When you use map projections, the lines of latitude and longitude become the grid lines on a flat map. Graticules are obtained by projecting lines of latitude and longitude from a sphere to a flat surface using map projections.

However, when you transfer a spherical shape to a flat surface, you approximate the true shape of the Earth. Depending on the map projection you choose, some projections may cause distance between features on a map to be preserved while distortion is introduced to shape. In some cases, area may be preserved while direction is distorted.

Cartographers choose map projections that best represents the purpose, size and shape of the area of interest on the map.

Source: GIS Geography

Esri’s commitment to Open: Open Data, Interoperability, … Open Source?!


By Muthukumar Kumar


Open source has gone from strength to strength in the last few years with the giants of the tech industry – Google, Facebook and others putting their code out for the entire world to use. Even Microsoft is using Linux to run some of its applications and operations.


In the geo-world, Mapbox, CartoDB and other start-ups have invested heavily on Open Source with great results so far. Esri – the Microsoft of the GIS industry with its strong enterprise market is also the de-facto GIS software at universities, seems to be slowly warming up to the idea of Open Source as well. They have a new landing page titled Open “esri/open“.


Interestingly, while the page seems to focus a lot on the company’s vision for interoperability and open standard, there is no separate tab for Open Source. Although, if one does navigate to the Get Involved page, there is more information regarding the GitHub page and other ideas.

Considering that Esri has started embracing (and using) Open Source libraries like Leaflet for their products, its interesting that the word on Open Source is still a bit muted. One no expects Esri or any other tech giant to open source their entire repository but sooner or later, the “Larry Ellison effect” as Wired likes to put it might just make it necessary for accelerated innovation and as we have seen with the Cloud computing industry, Open Source seems to be the best way forward for that.

Nevertheless, its important to acknowledge that the most famous GIS company in the world is starting to take strides in their Open policy. Only time will tell what else is in the works!

Tesla enters map making business. What does it mean for the industry?


By Aleks Buczkowski


We’ve been hearing about autonomous cars for a while now and with the launch of the new Tesla Autopilot feature we are one step further to get there.

There are four components needed for a self-driving car to become a reality on roads around the world: hardware (cars with a lot of sensors), software (smart algorithms that will safely interpret signals from these sensors), legislation (laws which will allow the car to drive without a human driver), and… Maps which are needed for the car to know where to go and how to get there. All of these are needed to make driverless cars hit the roads. Cars and sensors, as well as the system to operate it, are almost there. Legislation is still couple of years away but the significant progress has been done in that area. And how about maps?

The problem with maps is that they are so critical competent of the autonomous car equation, that car makers are afraid to rely on external data suppliers to provide it. This is why German car makers acquired HERE from Nokia, Uber bought part of Bing maps from Microsoft, Apple started to collect its own data and Google is operating StreetView vans around the world. The only independent data supplier for autonomous cars is TomTom (as OpenStreetMap is still a little but too unpredictable in terms of data completeness and accuracy).

We’ve seen a lot of interest in mapping business related to automotive industry this year and now Tesla seems to be going the same way. During the conference last Wednesday Tesla formally launched its long-awaited Autopilot feature, which is not quite a self-driving car, but rather a higher degree of autonomy. Together with it the company announced that it is entering the mapping business and starting to make high-precision digital maps based on sensor data from its cars.

Image: Tesla Motors

The strategy behind it is really interesting. Every Tesla car with Autopilot or not, is connected to the cloud. The company is constantly monitoring data from each car. With this approach Tesla gets tones of data with not extra costs (actually customers are paying for it). It sounds like a perfect model. In theory this data allows for automatic map making at a very little cost compared to Google, TomTom, HERE, Bing, Apple which are operating mapping vans around the world. These vans cost a fortune and Tesla is trying to do the same thing but much cheaper.

The question is if a company that has no clue about making maps can actually make one which is good enough? We’ve seen Apple tried to do so and… Do you know anyone who uses Apple Maps instead of Google Maps? The fact is that making and maintaining maps is a difficult and costly process, especially when we are talking about 3D maps with accuracy measured in centimeters rather than meters. On the other hand making maps for cars is much simpler than maps for human beings. You don’t have to map anything but road network.

We must remember that Tesla is not about how the industry and technology looks like today. In terms of visionary thinking Elon Musk is a decade ahead of the industry. Everyone says that maps could be made entirely based on probe data from connected cars but no one actually did that. He did. Maybe Tesla maps are not yet good enough yet but in 5-10 years they might be. If he succeeds it will mean a big change for the mapping industry. Every car will be a mapping car…

Palestine Uses GIS to Centrally Manage Urban Development


By Jamal Numan, Spatial Information Systems Department Director, Palestine's Ministry of Local Government, and Saed Abu Helwa, Technical Director and Chief Technology Officer, GISTEC


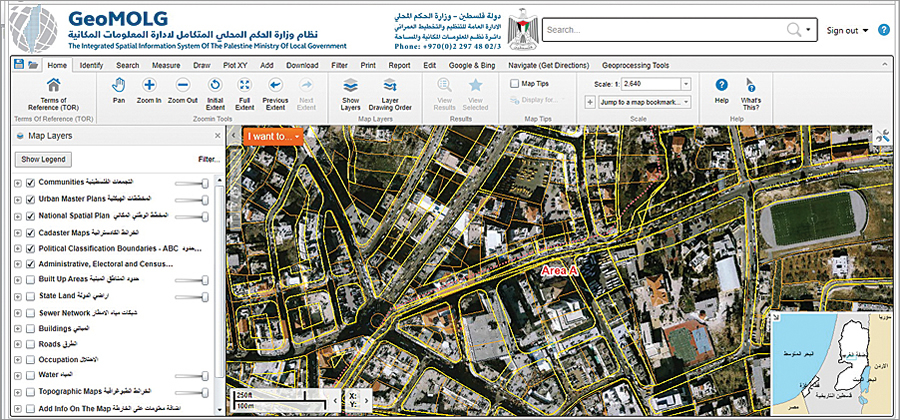
Palestine's Ministry of Local Government (MOLG) oversees municipalities and village councils in the West Bank and the Gaza Strip. It needed a way to effectively manage urban development in these two unconnected pieces of land. A team developed an enterprise GIS that disseminates real-time spatial information from one central location, reducing the time, cost, and manpower needed to collect and analyze this data.


GeoMOLG, pictured here, is a straightforward web mapping application that has helped Palestine's Ministry of Local Government collect data about land use and management and connect data with other government departments, nongovernmental organizations, and academic institutions.

Centralizing Urban Master Plans
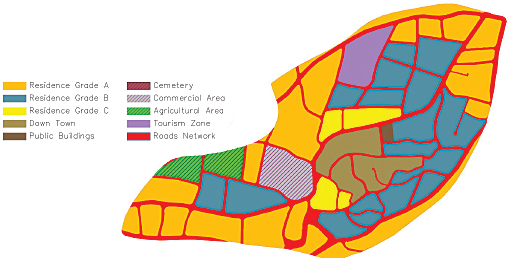
One of the ministry's key responsibilities is approving urban master plans in all of Palestine's cities, towns, and villages. Urban master plans assign land usage rights (whether a property will be residential, commercial, or agricultural, for example) and classify road networks (their placement, width, and slope) to inform planning and construction regulations. Given that the West Bank and the Gaza Strip are relatively small in size at around 3,700 square miles (6,000 square kilometers) with a small population of about 4 million people, MOLG wanted to be able to house all urban planning information in one database and have its Spatial Information Systems Department edit and manage data in real time at the local, regional, and national levels. MOLG also wanted to provide a user-friendly public portal whereby other government officials and the general public could easily access planning information for any location in the West Bank and the Gaza Strip.

After studying its requirements, MOLG decided that a robust web mapping application would best serve its needs. With full funding from the German Agency for International Cooperation (known by its German acronymGIZ) and development assistance from GISTEC, the official Esri distributor in the United Arab Emirates, a GIS team within the ministry created the Integrated Spatial Information System of the Palestine Ministry of Local Government, or GeoMOLG.

The Structure Behind the System
While the end product is a straightforward web mapping application, the data manipulation efforts required to support the team's ongoing operations are both extensive and critical. To keep within budget constraints, substantial efforts were made to reduce development and define areas of efficiency.

The team used CAD software to draw out land usage and road network features and implemented Safe Software's FME Desktop to convert hatches to polygon feature classes. All the urban master plans are stored in a single enterprise geodatabase on Microsoft's SQL Server to enable multiuser editing. The feature classes in the geodatabase are added to a map document in ArcGIS for Desktop and published using ArcGIS for Server, which makes sharing easy. End users then interact with and manipulate the spatial data using web viewers powered by Latitude Geographics' Geocortex. Additionally, field teams use ArcPad to continuously collect data—mostly on public utilities and facility locations—which can be uploaded straight to ArcGIS for Server and reflected on GeoMOLG in real time.
Connecting Data More Than Collecting It

Based on the success of the initial web mapping application, the ministry made additional data available on GeoMOLG beyond urban master plans, including land parcel specifications, agricultural classifications, local authorities' administrative boundaries, electoral districts, and even aerial photographs.

GeoMOLG now allows Palestine's Ministry of Local Government to centrally manage all urban master plans—such as this one for the community of Marda in the West Bank—throughout the West Bank and the Gaza Strip.

The ministry also allowed other government institutions to apply for access, which meant that not all the data would come from MOLG and that the end-user base would have varied interests. To manage the first issue, the team ensured that all users uploaded authoritative source data as map services, which maintains a link to the original source and displays this new information almost immediately on GeoMOLG. The team also worked with GISTEC to further customize the types of files users could add directly to the web application. Thus, GeoMOLG became more about connecting data than simply collecting it.

A Road Map for Future Development
With such a large amount of geographic information available in one place, GeoMOLG soon began fostering cross-disciplinary communication and collaboration on an unprecedented scale within the government and with nongovernmental organizations and academic institutions. It quickly became the most important source of spatial data in Palestine. In fact, at the application's official launch in November 2014, Palestinian Prime Minister Rami Hamdallah stressed the importance of further developing GeoMOLG by incorporating additional data and adding capabilities to expand its reach.

GeoMOLG has substantially increased the availability of spatial information and the efficiency of accessing it. By creating one space for users to access many types of spatial data, GeoMOLG has made it easier to make informed, fact-based decisions. It is no surprise, then, that this tool has become the key to defining strategies and formulating road maps for future development in Palestine.
About the Authors

Jamal Numan, who holds a master of science degree in GIS and has a background in civil engineering, is the enterprise spatial information systems expert at the Palestine Ministry of Local Government. He may be contacted at jamaln@molg.pna.ps.


Saed Abu Helwa is the technical director and chief technology officer at GISTEC. He has a master of science degree in communications and electronics and a bachelor of science degree in electrical engineering.

Source: ESRI

Σάββατο 24 Οκτωβρίου 2015

Healthy Soils for a Healthy Life


Healthy Soils for a Healthy Life is the motto of the UN International Year of Soils which aims to “increase awareness and understanding of the importance of soil for food security and essential ecosystem functions.” As explained on the campaign’s website, “soil is the thin layer of material on the Earth’s surface. It is a natural resource consisting of weathered and organic materials, air and water. As it is the medium in which plants establish themselves and grow, the most widely recognized function of soil is its support for food production. Soil provides nutrients and water that are absorbed through plant roots and contribute to the regulation of water and atmospheric gases and therefore play an important role in climate regulation.”


Soil therefore matters most where is is near human population, which at the same time puts soils under extreme pressure in these areas. Soil types not least determine where humans used to settle when they gave up their nomadic lifestyles and started becoming more stationary as farmers. Nowadays, some of the most fertile soils are found in the most densely populated spaces on the planet, which is shown in the following map. The map shows the major soil types classified in the FAO/UNESCO Soil Map of the World reprojected on a gridded population cartogram where a grid is resized to give every person living within a grid cell an equal amount of space (reducing the map in those spaces most where there are fewest people):


The colours used in this map differ from the original FAO map and this may not make it the aesthetically most beautiful map. However, this cartogram aims to highlight the most common soil types in those spaces where human settle, while it omits those spaces that are normally given most prominence in a conventional map. The soil types shown in the map “are classified on the basis of a combination of soil properties that are considered indicative of the way they have been formed. The quantity and the depth at which soil characteristics such as organic matter, clay, iron and soluble salt content occur are some of the factors that are used to define the major soil classes” (quoted from the IYS website).
The major soil groups can be described as follows (quoted from the 2008 FAO report: Harmonized world soil database manual):

ACRISOLS (AC): Soils with subsurface accumulation of low activity clays and low base saturationALISOLS (AL): Soils with sub-surface accumulation of high activity clays, rich in exchangeable aluminumANDOSOLS (AN): Young soils formed from volcanic depositsANTHROSOLS (AT): Soils in which human activities have resulted in profound modification of their propertiesARENOSOLS (AR): Sandy soils featuring very weak or no soil developmentCALCISOLS (CL): Soils with accumulation of secondary calcium carbonatesCAMBISOLS (CM): Weakly to moderately developed soilsCHERNOZEMS (CH): Soils with a thick, dark topsoil, rich in organic matter with a calcareous subsoilFERRALSOLS (FR): Deep, strongly weathered soils with a chemically poor, but physically stable subsoilFLUVISOLS (FL): Young soils in alluvial depositsGLEYSOLS (GL): Soils with permanent or temporary wetness near the surfaceGREYZEMS (GR): Acid soils with a thick, dark topsoil rich in organic matterGYPSISOLS (GY): Soils with accumulation of secondary gypsumHISTOSOLS (HS): Soils which are composed of organic materialsKASTANOZEMS (KS): Soils with a thick, dark brown topsoil, rich in organic matter and a calcareous or gypsum-rich subsoilLEPTOSOLS (LP): Very shallow soils over hard rock or in unconsolidated very gravelly materialLIXISOLS (LX): Soils with subsurface accumulation of low activity clays and high base saturationLUVISOLS (LV): Soils with subsurface accumulation of high activity clays and high base saturationNITISOLS (NT): Deep, dark red, brown or yellow clayey soils having a pronounced shiny, nut-shaped structurePHAEOZEMS (PH): Soils with a thick, dark topsoil rich in organic matter and evidence of removal of carbonatesPLANOSOLS (PL): Soils with a bleached, temporarily water-saturated topsoil on a slowly permeable subsoilPLINTHOSOLS (PT): Wet soils with an irreversibly hardening mixture of iron, clay and quartz in the subsoilPODZOLS (PZ): Acid soils with a subsurface accumulation of iron-aluminum-organic compoundsPODZOLUVISOLS (PD): Acid soils with a bleached horizon penetrating into a clay-rich subsurface horizonREGOSOLS (RG): Soils with very limited soil developmentSOLONCHAKS (SC): Strongly saline soilsSOLONETZ (SN): Soils with subsurface clay accumulation, rich in sodiumVERTISOLS (VR): Dark-coloured cracking and swelling clays


Soils in the most densely populated spaces on the planet are perhaps those most under threat – if they are not degraded already. As stated on the campaign’s website, “studies report that approximately 33% of our soils are facing moderate to severe degradation. The current rate of soil degradation threatens the capacity to meet the needs of future generations, unless we reverse this trend through a concerted effort towards the sustainable management of soils.” A lot more awareness will need to be raised amongst all stakeholders to stop this trend.


Amongst the efforts to tacke these issues is the Global Soil Week which is just under way this week. The motto Soil: The Substance of Transformationhighlights the importance of land and soil to achieve the Sustainable Development Goals as the successors of the Millennium Development Goals. Understanding the importance of soils is a first step in preserving them – and create healthy soils for a healthier and more sustainable life of humanity.

The content on this page has been created by Benjamin Hennig using data published byFAO. Please contact me for further details on the terms of use.