Εμφάνιση αναρτήσεων με ετικέτα Open data. Εμφάνιση όλων των αναρτήσεων

Τετάρτη 11 Νοεμβρίου 2015

ArcGIS Expresses Your Open Data


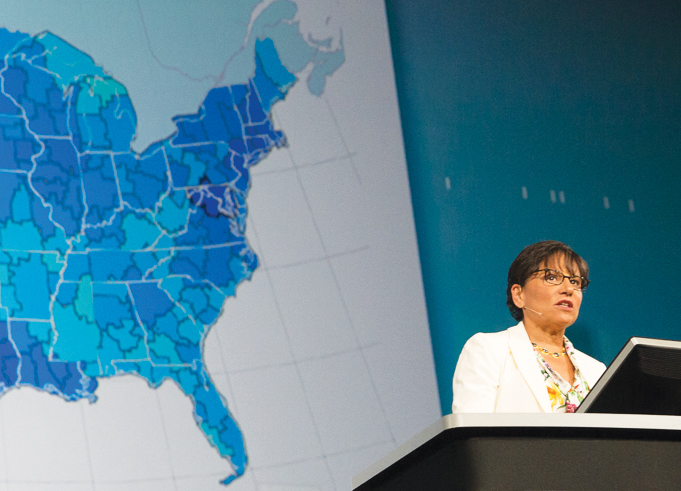
ArcGIS Open Data provides organizations around the world with the ability to share authoritative open data in multiple open formats. ArcGIS Open Data is an Esri-hosted and managed solution that comes free with ArcGIS Online. It enables users to set up public-facing websites where members of the community can search and download open data.

Below are some organizations that use ArcGIS Open Data to share their data for a variety of purposes.


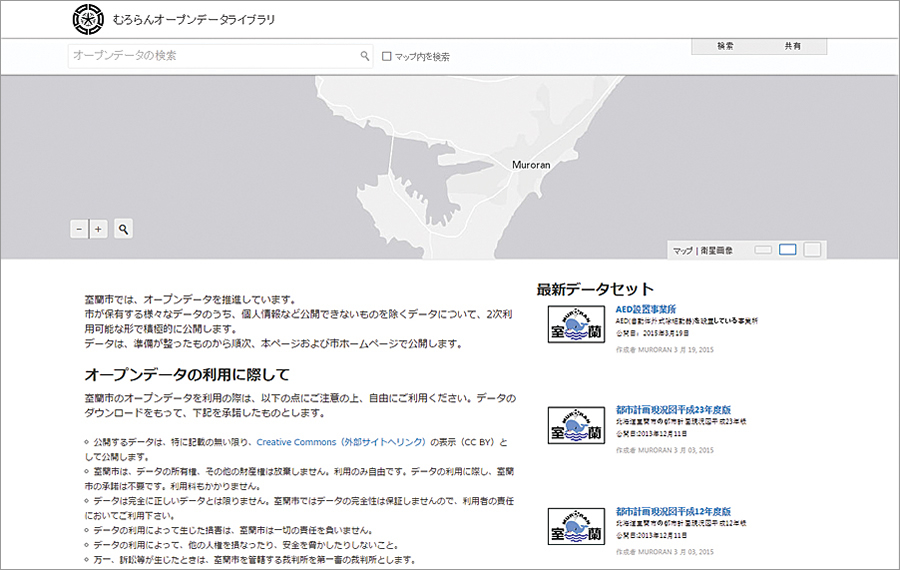
Muroran, Japan, Open Data Library

http://library.muroran.opendata.arcgis.com/?locale=ja
ArcGIS Open Data supports 25 different languages at no additional cost, giving the city of Muroran, Japan, the ability to share its open data with the public in Japanese.


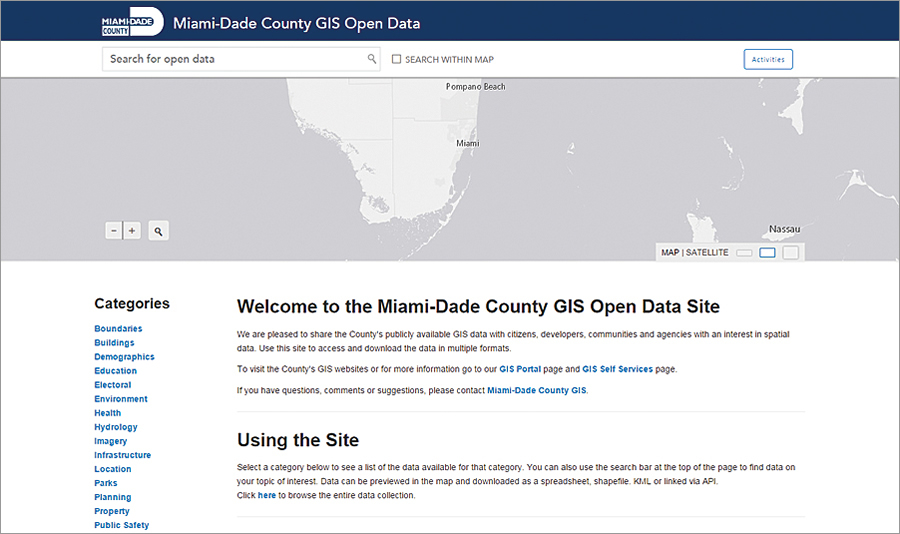
Miami-Dade County, Florida, GIS Open Data

http://gis.mdc.opendata.arcgis.com
Miami-Dade County actively uses its open data site to promote civic engagement. To make this effort sustainable and effective, Miami-Dade connects its data to the local communities that can use it to do great things by, for example, participating in local mapping and geospatial developer organizations such as MaptimeMIA and Code for Miami, the local Code for America brigade.


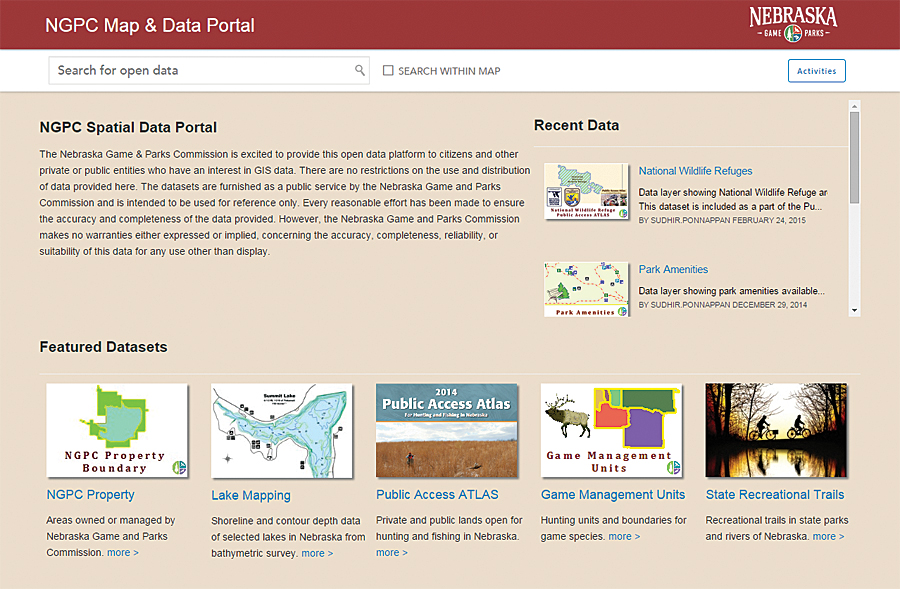
Nebraska Game and Parks Commission Open Data

http://data.outdoornebraska.gov
The Nebraska Game and Parks Commission uses its open data portal to share data about the state's fish, wildlife, park, and outdoor recreation areas. Its datasets are crafted to be authoritative, informative, and user-friendly. This open data site is a great resource for the public to find answers to common questions or to access data for geospatial analysis and application development.

To view other websites powered by ArcGIS Open Data or to create your own, visit esri.com/opendata.


Source: ESRI

Κυριακή 25 Οκτωβρίου 2015

Esri’s commitment to Open: Open Data, Interoperability, … Open Source?!


By Muthukumar Kumar


Open source has gone from strength to strength in the last few years with the giants of the tech industry – Google, Facebook and others putting their code out for the entire world to use. Even Microsoft is using Linux to run some of its applications and operations.


In the geo-world, Mapbox, CartoDB and other start-ups have invested heavily on Open Source with great results so far. Esri – the Microsoft of the GIS industry with its strong enterprise market is also the de-facto GIS software at universities, seems to be slowly warming up to the idea of Open Source as well. They have a new landing page titled Open “esri/open“.


Interestingly, while the page seems to focus a lot on the company’s vision for interoperability and open standard, there is no separate tab for Open Source. Although, if one does navigate to the Get Involved page, there is more information regarding the GitHub page and other ideas.

Considering that Esri has started embracing (and using) Open Source libraries like Leaflet for their products, its interesting that the word on Open Source is still a bit muted. One no expects Esri or any other tech giant to open source their entire repository but sooner or later, the “Larry Ellison effect” as Wired likes to put it might just make it necessary for accelerated innovation and as we have seen with the Cloud computing industry, Open Source seems to be the best way forward for that.

Nevertheless, its important to acknowledge that the most famous GIS company in the world is starting to take strides in their Open policy. Only time will tell what else is in the works!

Σάββατο 3 Οκτωβρίου 2015

US Department of Commerce Launches Open Data Initiative


In the next step of a major program to make federal government data more accessible, the US Department of Commerce convened a committee of leaders in technology to advise it on open data.

The Commerce Data Advisory Council (CDAC) brings together 19 technology industry leaders from private business, academia, state and local government, and nonprofit organizations to guide the Department of Commerce in revolutionizing its data assets and creating an ecosystem around its data products. The ultimate goal is to foster innovation, create jobs, and spur better decision making. Esri president Jack Dangermond is among those selected to participate.

The creation of CDAC is the next step in the Department of Commerce's effort to more robustly realize its capacity as America's data agency. With data-heavy agencies such as the US Census Bureau and the National Oceanic and Atmospheric Administration (NOAA) under its jurisdiction, US Secretary of Commerce Penny Pritzker believes that if the department partners more wisely with the private sector—especially via a common platform—its data can make governments smarter, businesses more competitive, and citizens better informed. It may even help inject more than $3 trillion of additional value into the global economy, according to a study published by consulting firm McKinsey & Company.

"The Department of Commerce has the tools necessary to develop, test, and grow the next phase of the open data revolution," said Pritzker in a speech at the 2014 Esri User Conference, where she announced her plan to hire the department's first chief data officer and subsequently convene the council.


US Secretary of Commerce Penny Pritzker spoke at the 2014 Esri User Conference, where she announced her plan to convene a council of technology leaders to advise the department on open data.

The US federal government and other governments around the world are increasingly embracing the open data movement, making their data freely available to other governments, agencies, university researchers, and the private sector. And they are learning from organizations that have already made headway in this realm.

A number of companies in the private sector have leveraged open data to foster innovation. Zillow, the American real estate information website, not only provides detailed property information to real estate professionals and homeowners, buyers, and renters but also openly publishes real estate and rental data for anyone who wants to take a deeper look at the numbers. Commercial weather companies have historically used a range of weather data—from NOAA datasets and international forecasts to satellite imagery and surface observations—to plan shipping routes; analyze climate change; and, of course, forecast weather.

The world of geospatial information, however, is just beginning to be heavily leveraged—and Esri is at the helm. ArcGIS Online, for example, gives users access to a trove of Esri- and contributor-based maps and datasets, which can be combined in myriad ways to give geographic context to any situation or issue. And with ArcGIS Open Data, a free technology for all ArcGIS Online subscribers, users can make their own data available to the public in various formats, including streaming services and multiple-format data downloads. Open Data allows organizations to build open data portals hosted on their own websites. Esri's Open Data website is also a portal where the public can search open data in a comprehensive commons environment.

Already, almost 1,900 organizations worldwide have embraced Open Data, including around 250 cities and more than 200 counties, and have shared more than 26,000 open datasets.

While open data is now becoming a cornerstone for Department of Commerce bureaus and offices, many of them have actually been making their data available to the public via the ArcGIS platform for years. Not only does data from NOAA and the Census Bureau infuse maps and layers in ArcGIS Online, but NOAA also leverages ArcGIS Online to access its GeoPlatform, which lets anyone browse story maps on topics such as rising sea levels, ocean economies, and how offshore minerals coalesce with coastal tourism.

With CDAC aiming to make Department of Commerce data easier to find, access, use, and combine with other datasets, geospatial data will become an even more valuable form of information. Esri users will also benefit from access to additional open data sources.

As Andrew Turner, Esri's chief technology officer for research and development in Washington, DC, said, "Location is a common context across all the different domains that data touches, and if we can bring Esri's perspective and geospatial focus [to CDAC], it can bring a lot of geographic context, expertise, and insight to the project."

Τετάρτη 5 Αυγούστου 2015

The Usability of a Web Mapping Application with a Million Rows of Data


Manuel Timita, Lead designer and developer, has written a guest article about Illustreets, a web mapping application built with Open Source software, open data, and emerging GIS technologies (i.e. CartoDB). This article showcases the importance of usability design when creating web mapping applications for the general public.

Illustreets is a property location research tool for those looking to move home in England. At its core, it is a web mapping application which embeds governmental open data into a series of dynamic layers created with CartoDB. The application has been designed to allow the exploration of any area in England, whilst getting on-the-fly local information. At the same time, full details about a particular location can be obtained by clicking on the map or searching for an address.


FIGURE1 – VIEW OF LONDON: THE MAP HIGHLIGHTS DIFFERENCES IN STANDARD OF LIVING ACROSS THE CITY.

When designing Illustreets, one of the most important usability problems that we needed to solve was that of information overload. We were dealing with approximately six million points representing incidents recorded by the police, nearly half a million public transport stations and stops, 22,000 schools, several million sold properties, and over a hundred census and deprivation variables.

With good information architecture becoming a top priority, every element directly linked to it, such as map tools, search operations, and navigation, had to be carefully designed.
Web usability in the context of Illustreets

Developing a web mapping application was a totally unfamiliar territory for us. However, our product was meant for a general audience and thus had to abide to general interaction design principles. As such, we turned to Jakob Nielsen’s (1995) 10 usability heuristics for UI design. In what follows, I will present the ones which have been essential for our application.

1) Visibility of system status

This is perhaps the most important aspect which has been highlighted in our usability tests – the users really appreciate quick and appropriate feedback.

On mouse hover, the information on the left panel is being updated in real time from data preloaded in the layers. If certain map areas are filtered out, they are marked accordingly. A click on the map or a search for a specific address places a loading sign on that particular location whilst the data is being transferred; at the same time, the content area is being opened:


FIGURE 2 – FEEDBACK ON DIFFERENT USER ACTIONS: MOUSE HOVER, AREA FILTERING, AND CLICK ON THE MAP.

2) Recognition rather than recall
Perhaps the most visible effect of this principle is the rather unconventional colour pattern used for the choropleth map. Initially, we went through a series of typical diverging colour schemes, obtained via ColorBrewer. However, during usability testing we discovered that very often the users needed to refer to the legend to remember the significance of colours. After successive iterations, we discovered that a simple “traffic lights” colour scheme is recognised and understood almost immediately.

3) Aesthetic and minimalist design

With the amount of data at our hand, we were easily at risk of overwhelming the users. Every unit of information competes with another within the same view. As a result, we opted to follow the principle of progressive disclosure and present only a minimum quantity of information at each step. Different page layouts and content tabbing are used to delimit the steps for obtaining the information. One such example is the switch between the full map view to presenting full area details:


FIGURE 3 – DIFFERENT PAGE LAYOUTS FOR DIFFERENT CATEGORIES OF INFORMATION.

Conclusion

Web mapping has matured beyond the point at which it is simply integrated with mainstream internet applications. At present, it is more likely for it to be an internet application in its own right.

The presentation of large amounts of information in a geographic context can pose serious challenges. However, mainstream usability design principles and heuristics, such as those devised by Jakob Nielsen, can still be applied in this context, helping to make a web mapping application more usable by the wider public.