An interactive GIS atlas tells a story about what the world was like in the past, what it's like right now, and what we can ask of it in the future. The US Forest Service (USFS) has one such GIS atlas, the Forest Atlas of the United States.
The Forest Atlas "represents a new strategy and architecture for sharing data, information, and knowledge with policy makers, resource managers, landowners, and constituents," explained project manager and research soil scientist Charles "Hobie" Perry.
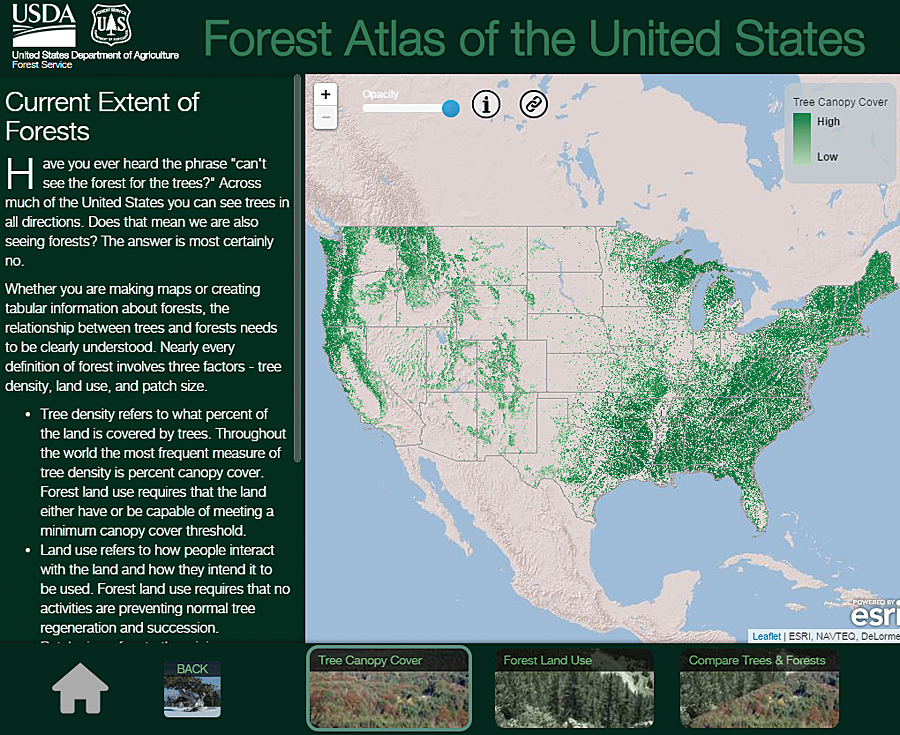
Built on Esri technology, the Forest Atlas is a resource for answering questions about how changes in forests affect people and the earth.
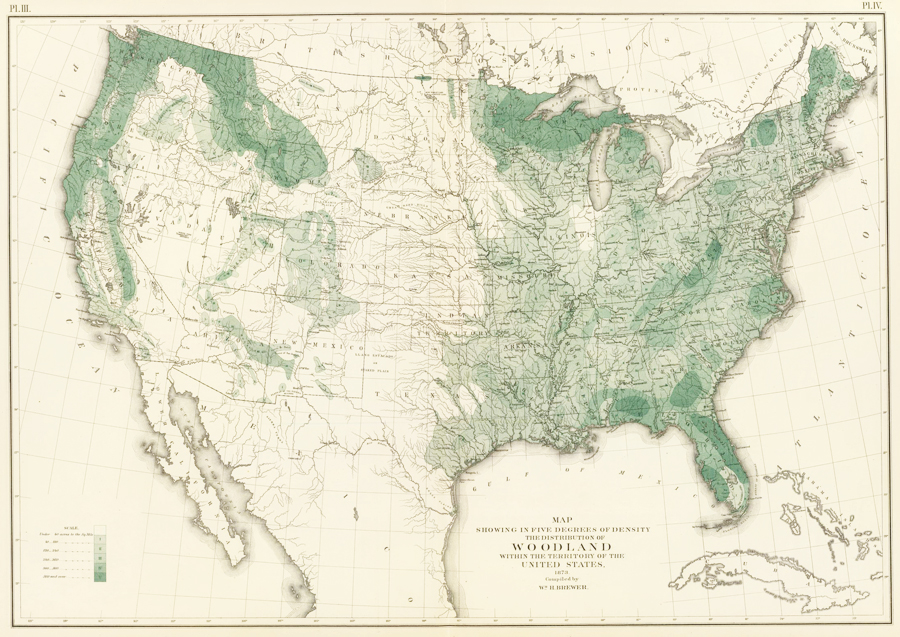
This 30-meter digital data of tree canopy cover has superseded William H. Brewer's map of woodland density from 1873.
A Bountiful Archive of Forest Maps
Forest maps have a long history in the United States. In 1873, William H. Brewer of the US Census Bureau produced one of the first maps of forests and woodlands. In 1898, George B. Sudworth, a dendrologist in the early Forest Service, published hisCheck List of the Forest Trees of the United States, Their Names and Ranges. From that, he and his team used contour maps of the United States to record where various forest flora could be found. The Forest Service and the US Geological Survey then published these maps in a loose-leaf volume in 1913—the firstForest Atlas of the National Forests of the United States.
But due to all the legwork that went into producing this, only one volume was published.
Forest Inventories Help Track Change
In 1928, the USFS began the Forest Inventory and Analysis (FIA) program, which manages information on forest conditions and reports on sylvan trends. FIA inventories describe the location, health, age, and tree species of forests. Forest managers need this information to write sustainable forest plans; understand the risks of fire, insect, and disease outbreaks; and schedule treatment activities such as harvests—all to maintain forest health.
This information has wider reaching applications as well. Water resource managers use forest data to trace water life cycles. State forest managers use it to track insects, diseases, and invasive species so they can implement effective treatments. Scientists rely on forest measurements to calculate how much carbon dioxide should be captured and stored for carbon sequestration. Natural resource planners also build strategies and design policies using forest changes measured over time.
Reviving the Forest Atlas
Because more forest analysts and scientists are incorporating geospatial analysis into their work, FIA is paying more attention to geospatial technology. Recently, the USFS decided to revive the Forest Atlas project to better organize its tremendous amounts of spatial data, and it used Esri technology to rebuild the resource.
The foundation for the new Forest Atlas is a set of highly accurate forest maps derived from FIA and other research projects. FIA inventories nearly 1,000 different plant species across 12 time zones, from Puerto Rico and the Virgin Islands in the Atlantic Ocean to the Marshall Islands and Palau in the Pacific Ocean. FIA recognizes species according to the US Department of Agriculture's Plants Database to eliminate the inherent biases that can arise when people inventory forests according to their own needs.
In addition to showcasing FIA inventory data, the Forest Atlas features datasets and information from across the agency. This includes the Forest Health Technology Enterprise Team's National Insect and Disease Risk Map, the Monitoring Trends in Burn Severity Program's burn severity and fire perimeter maps, and other researchers' historic tree species migration maps and future range projections.
In the Forest Atlas, this information is combined with other forest attributes to tell a comprehensive story about the forces shaping US forests and the ecosystem services they provide.
"Good data tells a very significant story," said FIA's national program manager Greg Reams. "This helps us demystify reasons why species shift in the forest. Geospatial analyses tell a story of change, [allowing] us to track invasive species and understand how these events are occurring."
The Forest Atlas addresses other related but broad forestry concerns as well, including changes in employment trends, biomass availability, land cover, and land use. It also helps the USFS, firefighters, and other responders better manage wildfires and aids scientists in analyzing carbon sequestration potential.
More Inclusive Fire Management Strategies
Fires are a natural event in any wooded landscape. When strategically managed, they help forests grow stronger and healthier. But native and invasive pests, overcrowded clusters of forest, and drought conditions reduce forests' resilience to fire and increase the likelihood that fires will be catastrophic.
The USFS and its partners need to integrate fire as a critical natural process in land and resource management but control wildfires that pass through properties with various ownership structures, all while implementing the best available science.
The Forest Atlas lets stakeholders and policy makers share essential knowledge for making environmentally sound and cost-effective fire management decisions. Sharing open data on GIS platforms ensures that everyone can understand and participate in these critical decisions.
Forecasting Carbon Sequestration Capabilities
US forests offset about 16 percent of the nation's annual carbon emissions, according to the USFS, making the Forest Atlas invaluable for designing carbon mitigation strategies.
People involved in discussions about climate change and carbon are very interested in forests' past; current; and, most of all, future carbon sequestration rates. These people are particularly keen on seeing various mapped-out scenarios that project carbon storage rates over the next 10 to 30 years.
Using Esri model building tools, researchers can construct simulations of future carbon sequestration based on variables such as population growth, fluctuations in gross domestic product, and changes in forest age and density. Forest Service scientists can also use projected climate scenarios—ranging from warm dry seasons to mild wet seasons—to calculate the effects these different conditions would have on future forest growth, including changing forest areas and carbon sequestration rates over the next 30 years. Analysts can then use these projections to forecast economic development such as housing starts, future lumber demand, and the quantity and quality of water that will be derived from forested ecosystems.
Complex and connected scenarios such as these are easier to understand when presented as geospatial displays. For example, positive and negative carbon storage levels can be represented as a range on a map so the resource community can see areas that need management action and policy makers and city planners can see what the effects will be.
Making the Forest Atlas Accessible
The Forest Atlas is available on the USFS GIS platform and is published in accordance with the Federal Geographic Data Committee's metadata standards. This makes it easy to integrate the information with other open data across government organizations.
"I see us aligning with other agencies, not just in a statistical manner but in a geospatial manner," Reams concluded. "Geographic metadata makes it easier to track monitoring information such as the shifts among land-use and land-cover categories, particularly forests, agriculture, and urban landscapes. The open-source data platform enables data integration among agencies in ways that will prove highly meaningful."
The general public can also access the atlas via ArcGIS Online and through the US government's open-source spatial data website.