Εμφάνιση αναρτήσεων με ετικέτα Water source management. Εμφάνιση όλων των αναρτήσεων

Πέμπτη 12 Νοεμβρίου 2015

Trimble Acquires Telog Instruments for Wireless Water Infrastructure Monitoring and Management


Trimble (NASDAQ: TRMB) announced today it has acquired privately held Telog Instruments, Inc. based in Victor, New York. Telog is a leader in wireless water infrastructure monitoring and management solutions. The acquisition extends Trimble’s smart water strategy by adding advanced water management technology and productivity solutions to the portfolio. Financial terms were not disclosed.

Telog, founded in 1984, manufactures a suite of wireless remote monitoring, analytics and data acquisition systems that are used by thousands of water, wastewater and stormwater management utilities and private contractors throughout North America. Its Telogers family of battery powered, environmentally rugged wireless monitors provide an automated means of collecting, archiving, presenting and sharing data from a wide variety of remote assets such as flowmeters, rain gauges, surcharge sensors, pre-treatment water quality sensors, lift stations and pressure sensors.

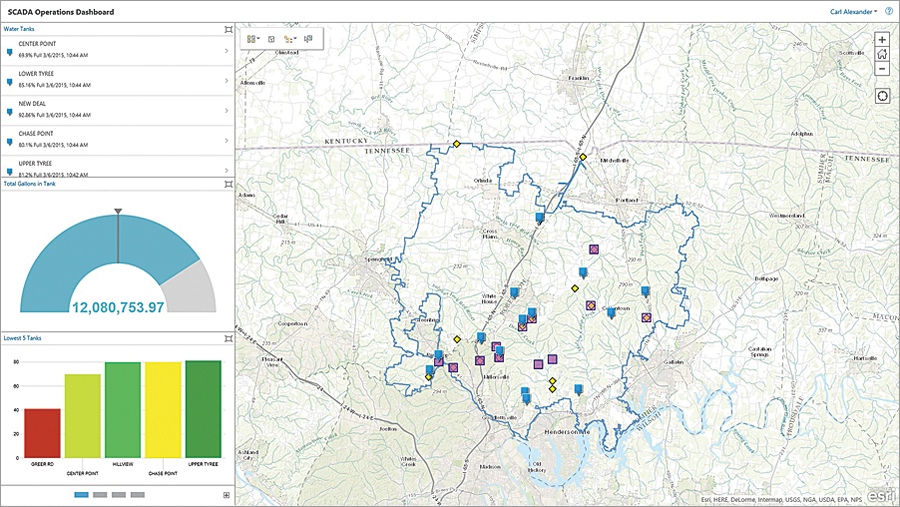
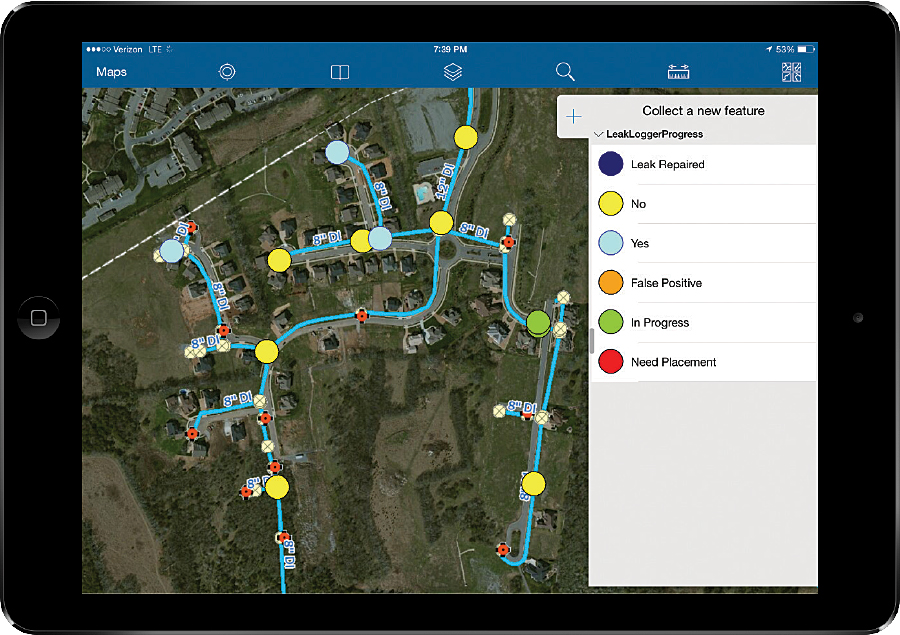
Applications for Telog solutions include remote monitoring of flow rates, reservoir and tank levels, water quality, well and groundwater levels, pump station performance, hydrant and valve pressure and sewer overflows. The solutions can also be combined with automated metering infrastructure to provide smart water networks that improve sustainability and water conservation and reduce leakage and non-revenue water. Customers can benefit through improved drinking water quality, lower water loss and leakage, reduced wastewater and stormwater overflows and spills, and enhanced regulatory compliance.

“Trimble remains focused on offering industry leading technology solutions for the water industry,” said Marcus McCarthy, general manager for Trimble’s Water Division. “The acquisition of Telog enables us to expand our portfolio of hardware and software products with industry leading real-time wireless sensors and monitoring solutions. The management of data in real time will provide value to customers facing a growing number of water supply, environmental and regulatory challenges.”

“We are very excited to join Trimble. In addition to the continued focus on supporting our current customers and our core North American market, the acquisition will enable us to grow Telog’s suite of products and expand our global footprint,” said Barry Ceci, founder, president and CEO of Telog. “This is an exciting time for Telog and our customers, who can also benefit from Trimble’s comprehensive portfolio of smart water management solutions.”

About Telog
Telog Instruments, Inc. was founded in 1984 and is an industry leader in wireless water infrastructure monitoring and management sensors and software solutions.

Telog solutions are derived from the combination of telemetry, data logging and information management technologies. The company offers comprehensive water distribution infrastructure monitoring systems and remote monitoring for wastewater collection system operators. Telog’s solutions provide an automated means of collecting, archiving, presenting and sharing data from remote assets such as flowmeters, rain gauges, CSO/SSO surcharge sensors, pre-treatment water quality sensors, lift stations and pressure sensors.

For more information, visit: www.telog.com.

About Trimble’s Water Division
Trimble’s Water Division specializes in field and office solutions for GIS mapping and work management, field data collection, design and inspection, and network management for water, wastewater and stormwater utilities, manufacturers and service providers around the world. Trimble’s solutions integrate advanced positioning, sensors and mapping technologies with software and hardware to automate utility mapping, design, construction and field operations, enabling increased productivity, enhanced regulatory compliance and improved customer service and response.

For more information about Trimble’s Water solutions, visit: www.TrimbleWater.com.

About Trimble
Trimble applies technology to make field and mobile workers in businesses and government significantly more productive. Solutions are focused on applications requiring positioning or location—including surveying, construction, agriculture, fleet and asset management, public safety and mapping. In addition to utilizing positioning technologies such as GPS, lasers and optics, Trimble solutions may include software content specific to the needs of the user. Wireless technologies are utilized to deliver the solution to the user in the field and to ensure communication between the field and the office. Founded in 1978, Trimble is headquartered in Sunnyvale, Calif.

For more information, visit: www.trimble.com.

Δευτέρα 9 Νοεμβρίου 2015

Tennessee Utility Proactively Stops Water Leaks


By Sarah Alban, Esri Writer


In 2013, the largest water and wastewater utility in Tennessee began transforming itself into a true GIS-centric organization.

White House Utility District (WHUD) is geographically Tennessee's largest water and wastewater utility. WHUD's service area extends 600 square miles and serves a population of just over 94,000.
On this dashboard, red indicates excessive leakage requiring field response.On this dashboard, red indicates excessive leakage requiring field response.


"We had reached a point where continuing to develop custom software interfaces between software applications became too restrictive," said Bill Thompson, WHUD general manager.

Historically, WHUD has used GIS for managing asset information, workflows, subdivision records, and customer service and activities such as performing trend detection analysis, rate modeling, and gross revenue projection; and tracking growth areas, water use, and lots that have sold and those that are available.

In 2005, WHUD implemented an extensive leak detection program that focused on the reduction of nonrevenue water [i.e., water lost in the distribution process that was not billable]. WHUD's large coverage area posed a number of unique challenges for the district. The number one challenge was getting accurate information that could be analyzed quickly. In the initial stages of the program, the district was very successful. It reduced water loss from leaks by 50 percent, but WHUD reached a point at which results plateaued.

Primarily, this occurred because the technology in use was unable to receive real-time information that could be integrated with other field asset information. The only way WHUD could move forward with the program was to overcome this problem, so it reached out to Esri.

By working closely with Esri, WHUD was able to configure a connection that feeds real-time information from the district's smart meters into ArcGIS. Esri also helped to configure the district's supervisory control and data acquisition (SCADA) system so that flow meters, tanks, and pump stations all display real-time data. This information is accessible via ArcGIS for Server and ArcGIS Online as a web app and dashboard.

The web app uses color coding to show how the actual flow for a district metered area (DMA) compares to what has been determined by the staff as an acceptable flow rate for a particular zone. Using a set of geoprocessing tools and models, WHUD office staff can find where water loss appears excessive and then isolate potential leaks down to subzones, individual valves, and specific pipe segments.

Water Leak Investigator, a solution that is a configuration of the Collector for ArcGIS app, lets field crews pull up detailed information on a specific leak that includes a projection of the number of gallons that is excessive for an area. Once a leaking area is identified, office staff create point features to let field staff know where to place the leak loggers and share that information using ArcGIS Online.

Field staff place loggers and leave them in place overnight. The next day, more staff go out and read the data from the loggers. The data is then input on the logger point feature so office staff can see if a leak has been identified.

"If we have found the leak, a work order is created to fix it," Thompson said. "If not, we continue the process in that area until the leak is found. Once the leak is found and fixed, the new flow data for this DMA zone is updated and the zone will change colors to reflect the repair."

All of the district's flow meters are set up with high- and low-flow alarms. Anytime a meter's readings go above or below the gallons-per-minute (GPM) thresholds, an alarm is sent. ArcGIS GeoEvent Extension for ArcGIS for Server receives that alarm and creates a GIS feature that notifies WHUD's personnel. Staff can access the alarm's location on any device through the point feature GeoEvent Extension creates.

Staff members can assess the situation in real time and compare it with historic data to determine if they need to dispatch a crew. For instance, after receiving a GeoEvent alert about a low-pressure tank, they can then compare that reading with historic pressure readings recorded for the tank and consult service data, such as customer call-ins related to low pressure, before making a decision.
Water Leak Investigator, a solution that is a configuration of the Collector for ArcGIS app, lets field crews pull up detailed information on a specific leak.Water Leak Investigator, a solution that is a configuration of the Collector for ArcGIS app, lets field crews pull up detailed information on a specific leak.

Three Days or Less to Repair All Leaks

Previously, it could take months to narrow down an underground leak to a specific location. Now leaks are detected and repaired within two to three weeks. The district will be able to cut repair times to 72 hours by July 1, 2015, and all field staff will have access to mobile GIS.

"The key benefit to ArcGIS in the field is the fact that

it can be viewed in real time," Thompson said. "This information allows us to be proactive rather than reactive."


The monetary savings that can be realistically achieved will likely exceed $1 million annually according to Pat Harrell, WHUD district engineer.

Beyond these direct monetary savings, there are less easily identified indirect savings. These indirect savings include recovered capacity for treatment plants and recovered distribution capacity in transmission lines. Rapid detection and repair of leaks also generate cost savings because less electricity is used, and there is less wear and tear on equipment. In addition, because the system is more efficient and proactive, there is less need for employees to work overtime.

Those benefits have a direct effect on WHUD's customers because they affect both short- and long-term water rates. WHUD expects initial savings to offset the cost of installing smart meters and the information technology infrastructure.

Other utilities in the region have made site visits to learn how WHUD is using technology to effectively detect leakage that is not coming to the surface.

"With ArcGIS Online, it's not as daunting as half the people think it is," Alexander said. "Using out-of-the-box COTS solutions like Collector has made it simple to get the tools deployed into the hands of our team quickly."

According to Harrell, "So much data is coming in the system at this point that the district has been caught a little off guard by the speed and quality of the information collected."
GIS Moves to a Leadership Role

So far, WHUD has improved planning, decision making, and customer service with the leak detection system. "The best part is that you don't have to be an engineer to make use of the GIS," Harrell said.

Customer service representatives now access the web map when customers call in. They can see right away if there are pressure issues and are able to confidently explain the situation. They are even using ArcGIS Pro to see 3D data visualizations that illustrate the effect of elevation in tank and pump station pressure to provide more accurate interpretations. With just a few minutes of analysis, staff can determine if low- to no-pressure conditions or other issues exist and use their findings to troubleshoot customer questions or work with developers on pressure issues.

After WHUD completes the smart meter installation, it will continue developing additional real-time data integration with its GIS. The information will display on simple, accessible viewers that tap into critical big data feeds.


"When we decided to move to a true GIS-centric environment, we felt like it was critical to examine every aspect of our organization from top to bottom," Thompson said. "In so doing, one of the things that I personally felt strongly about was the role GIS should play in the organization. I felt GIS should not report to the engineering department but should work collaboratively with them. I also felt equally as strong that IT should report to GIS instead of GIS reporting to IT. If we are to achieve our goal of having a true GIS-centric environment, GIS must be moved from an afterthought in the organization to a leadership role where our actions support our commitment."

Source: ESRI

Τετάρτη 28 Οκτωβρίου 2015

Find Out Where the Water Goes


The Nighttime Flow Analysis solution, a COTS configuration of the ArcGIS platform, helps water utilities identify areas with underground leaks and other sources of nonrevenue water loss.

Nighttime Flow Analysis measures gallons per minute (GPM) of water consumption for an area at night, when households typically use significantly less water. It compares that rate to the expected flow estimated using industry standards for minimum nighttime uses—such as the use of toilets, washing machines, and outdoor irrigators—to determine potential nonrevenue water loss, or water flows that are not reaching a meter.

This solution is a collection of services, maps, and apps supported on ArcGIS 10.3 that helps utilities find and fix underground leaks and other sources of water loss that might go undetected for months. Rapidly identifying and eliminating unnecessary water loss provide better service, more efficient distribution to customers, less wear on treatment equipment, and longer-term value from capital-improvements spending.

Over the long term, Nighttime Flow Analysis can improve utility operations and capital planning by reducing high water loss, preventing service disasters, and reducing the time needed to make repairs from months to weeks or days.

Read the accompanying article in this issue "Tennessee Utility Proactively Stops Water Leaks" and learn how Tennessee's largest water and wastewater utility, White House Utility District (WHUD), uses other ArcGIS for Utilities solutions to manage its 600-square-mile service area.

For more information on Nighttime Flow Analysis, visit solutions.arcgis.com/utilities/water/help/nighttime-flow-analysis/.


Source: ESRI

Τρίτη 27 Οκτωβρίου 2015

Water Utilities: GIS has Changed Have You?


By Matt Sheenan


Water utilities both big and small are faced with a range of different challenges. A recent American Water Works Association (AWWA) report listed but a few:

1. Condition of water/wastewater infrastructure
2. Water scarcity/supply
3. Drought potential
4. Customer/community relations
5. Emergency planning and response
6. Government regulations
7. Managing assets

New technology is today helping to provide solutions to these challenges. Key among these technologies is GIS.

Water Utilities: GIS has Changed Have You?
GIS is not new. It is a technology which today is undergoing dramatic changes. Changes which are making it easier to afford, access and use. So what are these changes?

Cloud Based GIS is a Game Changer
Gone are the days when you as an organization need to deal with the complexity and expense of setting up and hosting a GIS internally. Cloud based GIS is now here. That means others maintaining your GIS, simply set up a subscription to Esri’s ArcGIS for example and go. Its as simple as that. GIS subscriptions are very affordable even to the smallest utilities. Internal staff are no longer required to maintain and update your GIS. Maybe most importantly it has never been easier to administer a GIS and publish maps.

If cloud based GIS solutions are not your cup of tea, with releases like Portal for ArcGIS, you can now host your own version of ArcGIS Online inside your firewall.

No More Data Silos
We once lived in a world where authoritative data was hard to find. Reliable water main data was over here, updated valve inspection data over there. A GIS provides a central system for all your data. Your organizations authoritative data or system of record. Anybody in your organization who needs access to any asset or asset related data can simply access your GIS.

Mobile Maps, Mobile GIS Apps
Mobile devices – smartphone, and tablets – are transforming society. Today we all carry miniaturized computers, which know through GPS where they are at all times. Apps which provide interactive maps are extremely popular. GIS not only provides maps, it allows water utility field staff to better get their jobs done.


We have been building a simple asset management mobile ArcGIS application for utilities which works both online and offline, is configurable and runs on any device and any platform (Apple, Android, Windows). Its an elegant solution for those who are looking to move away from ArcPad or cannot afford enterprise GIS asset management platforms.

New Configurable Applications for Water Utilities
There has been a new move in the world of GIS to provide focused, targeted configurable applications. Esri have been particularly busy here. ArcGIS for Water Utilities is a suite of applications designed to solve specific challenges. Whether it is tracing illicit discharge, finding polluters, analyzing water loss, responding to emergencies, generating water reports or connecting with customers. There is an easy to set up application designed for that purpose.


We have been working with a number of utilities helping them take advantage of these solutions.

GIS has come a long way in the last 2 years. More affordable, easier to access and use. If you are not actively using GIS and the new tools available to manage your water utility, you are missing out on a crucial time and cost saving technology.


Contact us for more information on 801-733-0723.

Κυριακή 18 Οκτωβρίου 2015

To Take Earth’s Pulse, You Have to Fly High


Ecologist Greg Asner and his team at the Carnegie Institution for Science can measure the biomass of a forest from the air. In this false-color video of Amazon rain forest in Peru, the biggest, heaviest trees are red, while yellow, green, and blue trees are progressively lighter. Carnegie's research aircraft is equipped with a scanning lidar—a laser ranging device that works like radar—and imaging spectrometers.


Story by Peter Miller
THE VIEW OUT THE WINDOW WAS BAD ENOUGH. As his research plane flew over groves of California’s giant sequoias, some of the world’s tallest trees, Greg Asner could see the toll the state’s four-year drought had taken. “It looked wicked dry down there,” he said. But when he turned from the window to the video display in his flying lab, the view was even more alarming. In places, the forest was bright red. “It was showing shocking levels of stress,” he said.

The digital images were coming from a new 3-D scanning system that Asner, an ecologist with the Carnegie Institution for Science, had just installed in his turboprop aircraft. The scanner’s twin lasers pinged the trees, picking out individual branches from 7,000 feet up. Its twin imaging spectrometers, one built by NASA’s Jet Propulsion Laboratory (JPL), recorded hundreds of wavelengths of reflected sunlight, from the visible to the infrared, revealing detailed chemical signatures that identified each tree by species and even showed how much water it had absorbed—a key indicator of health. “It was like getting a blood test of the whole forest,” Asner said. The way he had chosen the display colors that day, trees starved of water were bright red.


As California's historic drought continues, scientists are turning to remote sensing from the skies. Orbiting satellites measure groundwater depletion, and aircraft monitor the snowpack and the tree canopy's chemical composition, bringing crucial information to those working to alleviate the drought—and to the people who depend on them.

Disturbing as the images were, they represented a powerful new way of looking at the planet. “The system produces maps that tell us more about an ecosystem in a single airborne overpass,” Asner wrote later, “than what might be achieved in a lifetime of work on the ground.” And his Carnegie Airborne Observatory is just the leading edge of a broader trend.

At a time when human impacts on the planet are unprecedented, technology offers a chance to truly understand them.

A half century after the first weather satellite sent back fuzzy pictures of cloudsswirling over the North Atlantic, advanced sensors are doing for scientists what medical scanners have done for doctors—giving them ever improving tools to track Earth’s vital signs. In 2014 and early 2015 NASA launched five major Earth-observing missions (including two new instruments on the space station), bringing its total to 19. Space agencies from Brazil, China, Europe, and elsewhere have joined in. “There’s no question we’re in a golden age for remote sensing,” said Michael Freilich, NASA’s earth science director.


Four years of drought have taken a harsh toll on California's farms and forests. Last spring Greg Asner and his team flew over the Sierra Nevada, home to sequoias and other giant trees. With the new instruments on their airplane, the researchers completed in days a damage survey that would have taken a lifetime from the ground.
PHOTOGRAPH BY GREGORY ASNER, CARNEGIE INSTITUTION FOR SCIENCE


Climate Change Is Here

Germany Could Be a Model for How We’ll Get Power in the Future


The news from all these eyes in the sky, it has to be said, is mostly not good. They bear witness to a world in the midst of rapid changes, from melting glaciers and shrinkingrain forests to rising seas and more. But at a time when human impacts on Earth are unprecedented, the latest sensors offer an unprecedented possibility to monitor and understand the impacts—not a cure for what ails the planet, but at least a better diagnosis. That in itself is a hopeful thing.


WHAT THIS IS It’s a map of atmospheric carbon dioxide over land last summer, made by NASA’s OCO-2 satellite. Red areas have a bit more CO₂, green areas a bit less, than the global average of 400 parts per million.

WHAT THIS TELLS US Forests and oceans have slowed global warming by soaking up some of the CO₂ we emit. OCO-2 will shed light on where exactly it’s going—and on how fast the planet could warm in the future.MAP BY NGM STAFF: SOURCE NASA/JPL

WATER IS EARTH’S LIFEBLOOD, and for the first time, high-flying sensors are giving scientists a way to follow it as it moves through every stage of its natural cycle: falling as rain or snow, running into rivers, being pumped from aquifers, or evaporating back into the atmosphere. Researchers are using what they’ve learned to predict droughts, warn of floods, protect drinking water, and improve crops.

Forest


WHAT THIS IS The Carnegie Airborne Observatory made this image of rain forest in Panama with its scanning lidar, which probes the trees’ size and shape, and a spectrometer that charts their chemical composition.

WHAT THIS TELLS US The technique allows Asner's team, flying at 7,000 feet, to identify individual trees from their chemical signatures—and even to say how healthy they are. The reddish trees here (the colors are arbitrary) are growing the fastest and absorbing the most CO₂.PHOTOGRAPH BY GREGORY ASNER, CARNEGIE INSTITUTION FOR SCIENCE
In California the water crisis has turned the state into something of a laboratory for remote-sensing projects. For the past three years a NASA team led by Tom Painter has been flying an instrument-packed aircraft over Yosemite National Park to measure the snowpack that feeds the Hetch Hetchy Reservoir, the primary source of water for San Francisco.
Until now, reservoir managers have estimated the amount of snow on surrounding peaks the old-fashioned way, using a few gauges and taking surveys on foot. They fed these data into a statistical model that forecast spring runoff based on historical experience. But lately, so little snow had fallen in the Sierra Nevada that history could offer no analogues. So Chris Graham, a water operations analyst at Hetch Hetchy, accepted the NASA scientists’ offer to measure the snowpack from the sky.

Water


WHAT THIS IS It’s an image of the Tambopata River in eastern Peru made by the scanning lidar aboard the Carnegie observatory.

WHAT THIS TELLS US The area in this image is actually covered with rain forest. Some lidar pulses penetrate the forest and reflect off the ground, revealing the subtle topography—red is a few feet higher than blue—and faint, abandoned river channels that have shaped the forest and helped create its rich biodiversity.
PHOTOGRAPH BY GREGORY ASNER, CARNEGIE INSTITUTION FOR SCIENCE
Painter’s Twin Otter aircraft, called the Airborne Snow Observatory, was equipped with a package of sensors similar to those in Greg Asner’s plane: a scanning lidar to measure the snow’s depth and an imaging spectrometer to analyze its properties. Lidar works like radar but with laser light, determining the plane’s distance to the snow from the time it takes the light to bounce back. By comparing snow-covered terrain with the same topography scanned on a snow-free summer day, Painter and his team could repeatedly measure exactly how much snow there was in the entire 460-square-mile watershed. Meanwhile the imaging spectrometer was revealing how big the snow grains were and how much dust was on the surface—both of which affect how quickly the snow will melt in the spring sun and produce runoff. “That’s data we’ve never had before,” Graham said.

Land


WHAT THIS IS NASA’s Aqua satellite captured these visible-light images of California and Nevada on March 27, 2010 (left), the most recent year with normal snowfall, and on March 29, 2015 (right).

WHAT THIS TELLS US After four years of drought, the snowpack in the Sierra Nevada—a crucial water reservoir for California—is just 5 percent of the historical average. Snow has virtually vanished from Nevada. And west of the Sierra, in the Central Valley, much of the fertile farmland is fallow and brown.
PHOTOGRAPHS COURTESY NASA
Painter also has been tracking shrinking snowpacks in the Rocky Mountains, which supply water to millions of people across the Southwest. Soon he plans to bring his technology to other mountainous regions around the world where snow-fed water supplies are at risk, such as the Himalayan watersheds of the Indus and Ganges Rivers. “By the end of the decade, nearly two billion people will be affected by changes in snowpacks,” he said. “It’s one of the biggest stories of climate change.”


WITH LESS WATER FLOWING into California’s rivers and reservoirs, officials have cut back on the amount of water supplied to the state’s farmers, who typically produce about half the fruits, nuts, and vegetables grown in the U.S. In response, growers have been pumping more water from wells to irrigate fields, causing water tables to fall. State officials normally monitor underground water supplies by lowering sensors into wells. But a team of scientists led by Jay Famiglietti, a hydrologist at the University of California, Irvine, and at JPL, has been working with a pair of satellites called GRACE(for Gravity Recovery and Climate Experiment) to “weigh” California’s groundwater from space.
Planet Probes
Earth's vital signs are monitored by NASA's 19 Earth-observing missions. Ten of the most critical, shown here, circle the globe up to 16 times a day, collecting data on climate, weather, and natural disasters.

MONICA SERRANO, NGM STAFF; TONY SCHICK
SOURCE: STEVEN E. PLATNICK AND CLAIRE L. PARKINSON, NASA GODDARD SPACE FLIGHT CENTER


The satellites do this by detecting how changes in the pull of Earth’s gravity alter the height of the satellites and the distance between them. “Say we’re flying over the Central Valley,” Famiglietti said, holding a cell phone in each hand and moving them overhead like one satellite trailing the other. “There’s a certain amount of water down there, which is heavy, and it pulls the first satellite away from the other.”

The GRACE satellites can measure that to within 1/25,000 of an inch. And a year later, after farmers have pumped more water out of the ground, and the pull on the first satellite has been ever so slightly diminished, the GRACE satellites will be able to detect that change too.

Depletion of the world’s aquifers, which supply at least one-third of humanity’s water, has become a serious danger, Famiglietti said. GRACE data show that more than half the world’s largest aquifers are being drained faster than they can refill, especially in the Arabian Peninsula, India, Pakistan, and North Africa.

Since California’s drought began in 2011, the state has been losing about four trillion gallons a year (more than three and a half cubic miles) from the Sacramento and San Joaquin River Basins, Famiglietti said. That’s more than the annual consumption of the state’s cities and towns. About two-thirds of the lost water has come from aquifers in the Central Valley, where pumping has caused another problem: Parts of the valley are sinking.

This concrete wellhead on Allan Clark’s almond farm at Chowchilla, east of Los Banos in California’s Central Valley, used to be flush with the ground. But groundwater pumping accelerated by drought has caused the land to sink—in some places, according to satellite measurements, by around a foot a year. Two of Clark’s irrigation wells have run dry; he’s on a waiting list to have one deepened.
PHOTOGRAPH BY MARK THIESSEN, NGM STAFF
The spectrometer view would be like “Star Trek technology”: We’d be able to see and name individual trees from space.

Tom Farr, a geologist at JPL, has been mapping this subsidence with radar data from a Canadian satellite orbiting some 500 miles up. The technique he used, originally developed to study earthquakes, can detect land deformations as small as an inch or two. Farr’s maps have shown that in places, the Central Valley has been sinking by around a foot a year.

One of those places was a small dam near the city of Los Banos that diverts water to farms in the area. “We knew there was a problem with the dam, because water was starting to flow up over its sides,” said Cannon Michael, president of Bowles Farming Company. “It wasn’t until we got the satellite data that we saw how huge the problem was.” Two sunken bowls had formed across a total of 3,600 square miles of farmland, threatening dams, bridges, canals, pipelines, and floodways—millions of dollars’ worth of infrastructure. In late 2014 California governor Jerry Brown signed the state’s first law phasing in restrictions on groundwater removal.

AS EVIDENCE HAS MOUNTED about Earth’s maladies—from rising temperatures and ocean acidification to deforestation and extreme weather—NASA has given priority to missions aimed at coping with the impacts. One of its newest satellites, a $916 million observatory called SMAP (for Soil Moisture Active Passive), was launched in January. It was designed to measure soil moisture both by bouncing a radar beam off the surface and by recording radiation emitted by the soil itself. In July the active radar stopped transmitting, but the passive radiometer is still doing its job. Its maps will help scientists forecast droughts, floods, crop yields, and famines.


No one gets a better look at how we’ve transformed Earth—and conquered night—than astronauts on the space station. The view here is to the north over Portugal and Spain. The green band is the aurora.
PHOTOGRAPH COURTESY NASA
“If we’d had SMAP data in 2012, we easily could have forecast the big Midwest drought that took so many people by surprise,” said Narendra N. Das, a research scientist at JPL. Few people expected the region to lose about $30 billion worth of crops that summer from a “flash drought”—a sudden heat wave combined with unusually low humidity. “SMAP data could have shown early on that the region’s soil moisture was already depleted and that if rains didn’t come, then crops were going to fail,” Das said. Farmers might not have bet so heavily on a bumper crop.

Climate change also is increasing the incidence of extreme rains—and SMAP helps with that risk too. It can tell officials when the ground has become so saturated that a landslide or a downstream flood is imminent. But too little water is a more pervasive and lasting threat. Without moisture in the soil, a healthy environment breaks down, as it has in California, leading to heat waves, drought, and wildfires. “Soil moisture is like human sweat,” Das said. “When it evaporates, it has a cooling effect. But when the soil is devoid of moisture, Earth’s surface heats up, like us getting heatstroke.”

DESPITE ALL THE CHALLENGES
to Earth’s well-being, the planet so far has proved remarkably resilient. Of the 37 billion metric tons or so of carbon dioxide dumped into the atmosphere each year by human activities, oceans, forests, and grasslands continue to soak up about half. No one knows yet, however, at what point such sinks might become saturated. Until recently, researchers didn’t have a good way to measure the flow of carbon in and out of them.

That changed in July 2014, when NASA launched a spacecraft called the Orbiting Carbon Observatory-2. Designed to “watch the Earth breathe,” as managers put it, OCO-2 can measure with precision—down to one molecule per million—the amount of CO₂ being released or absorbed by any region of the world. The first global maps using OCO-2 data showed plumes of CO₂ coming from northern Australia, southern Africa, and eastern Brazil, where forests were being burned for agriculture. Future maps will seek to identify regions doing the opposite—removing CO₂ from the atmosphere.

Greg Asner and his team also have tackled the mystery of where all the carbon goes. Prior to flying over California’s woodlands, they spent years scanning 278,000 square miles of tropical forests in Peru to calculate the forests’ carbon content.

At the time, Peru was in discussions with international partners about ways to protect its rain forests. Asner was able to show that forest areas under the most pressure from logging, farming, or oil and gas development also were holding the most carbon—roughly seven billion tons. Preserving those areas would keep that carbon locked up, Asner said, and protect countless species. In late 2014 the government of Norway pledged up to $300 million to prevent deforestation in Peru.

Within the next few years NASA plans to launch five new missions to study the water cycle, hurricanes, and climate change, including a follow-up to GRACE. Smaller Earth-observing instruments, called CubeSats—some tiny enough to fit into the palm of a hand—will hitch rides into space on other missions. For scientists like Asner, the urgency is clear. “The world is in a state of rapid change,” he said. “Things are shifting in ways we don’t yet have the science for.”

Within the next decade or so the first imaging spectrometer, similar to the ones used by Asner and Painter, could be put into Earth orbit. It would be like “Star Trektechnology” compared with what’s up there now, Painter said. “We’ve orbited Jupiter, Saturn, and Mars with imaging spectrometers, but we haven’t had a committed program yet for our own planet,” he said. The view from such a device would be amazing: We’d be able to see and name individual trees from space. And we’d be reminded of the larger forest: We humans and our technology are the only hope for curing what we’ve caused.

Παρασκευή 28 Αυγούστου 2015

Water resource managment and Remote Sensing, a prospective issue that requires considerable attention


By Riazuddin Kawsar


Background:
Water Remote sensing is a means of monitoring the water color and temperature, which provides information on the presence and loads of optically active substances in the water and that has hundreds of practical applications in the arena water resource management.

For an example, Surface runoff from agricultural land can carry nutrients (i.e., nitrogen and phosphorus from fertilization of crops) into that water bodies that might cause algal blooms and have the potential to degrade the water quality (i.e., fish kills). Satellite remote sensing derived indicators such as chlorophyll, can monitor that algal bloom thus monitoring water quality in a spatio-temporal fashion.

Incessant pressure on water resource caused by population growth and climate variability is obvious and there is a little quantitative information available to capture the spatial and temporal variability in water quality and quantity and therefore hard to derive efficient and effective water resource management policy.

Water Remote Sensing Applications:
Satellite Remote Sensing (RS) or Earth Observation (EO) can be crucial in understanding the spatio-temporal dynamics of water quantity and quality, which can be used to simulate water resources management scenarios under different water quantity/quality demand and derive effective policy recommendations, accordingly. Besides, EO also can competently assist different phases of water resource management projects’ life-cycle. In this context, Some of the widely used RS techniques are itemed bellow:

Surface Water Quantity: In context of water resource management, one of the key argument is the lack of the ground data, which plays an important role in evaluating the status of water resource and taking useful measures to respond the threat of water scarcity. In this regard, EO can offers standardized and long-term observations to address such challenges.

The EO capability of multi-temporal imaging and satellite imagery based indices (i.e., Normalized Difference Water Index (NDWI)), can efficiently identify, map and calculate the total surface area of the water bodies in different seasons (i.e., dry, wet) and by integrating satellite altimetry measurements we can quantify and monitor the water storage change over time.


The Aral Sea was once the world’s fourth-largest lake, but as can be seen in the four satellite images, has decreased in size over the last forty years; Images: USGS, EROS Data Center

Ground water Quantity: For planning and management of our water resource, we need to know, globally how much fresh water we have. Gravity Recovery and Climate Experiment (GRACE), an EO mission made possible to have an idea of how much ground water we have and how much we are extracting every day that was almost impossible to quantify few years back.

GRACE continuously measuring the changes in earth’s mass hence gravity that are mainly due to water moving on and under the surface. The negative change in gravity is the indication of losing mass, which means falling water table and by monitoring the changes over time we can estimate the rate of diminishing water table, which has strong water policy implication.


GRACE satellite data showing California’s groundwater depletion in recent years. Image: NASAJPL

Surface Water Quality: Regarding water quality, there are several indicators, which are commonly used to describe and assess the water quality. Such as, water temperature, nutrients presence and abundance, total suspended solid, turbidity, presence of humic substances etc. EO can efficiently communicate with almost all kind of mentioned indicators very efficiently. For an instance, one of the most popular remote sensing based water quality parameters is chlorophyll-a, which can explain the nutrients presence and abundance in the water. Besides, Total Suspended Matter (TSM) concentrations as well as attenuation coefficient (Kd) can be used to measure the water turbidity and Colored Dissolved Organic Matter (CDOM) can play the proxy role to assess the presence of humic substances in the water.

Multi-temporal analysis of these remote sensing based parameters can provide more deeper understanding of our water quality dynamics or variability over time (i.e., seasonal or long-term). Besides, remote sensing based water quality indicators in combination with land use and other spatial information, we can successfully not only detect the eutrophication sources but also can understand the mechanisms, which are most likely caused by high rate of unmanaged urbanization and intensification of agricultural use of lands surrounding the water bodies which put pressures on the water bodies’ ecosystem.


These images show true-color imagery and water quality (i.e., water clarity) data for Green Bay, Wisconsin during the summer of 2001. (Images courtesy Jonathan Chipman, Center for Limnology and Environmental Remote Sensing Center, University of Wisconsin)

Ground Water Quality: Besides the surface water quality assessment, we also can study ground water quality assessment using remote sensing technologies. For an example, we know groundwater discharge (GD) is a potential source of nutrients and algal bloom, which is an indicator of nutrient release in the water bodies. Now, If we know about the seasonal variability of ground water discharge and if the seasonal algal blooming variability correlates with the GD variability that can be an indicator of groundwater quality.

Water Project Management: EO-based information can be of important in view of implementing, coordinating, and monitoring large-scale water related projects and long term strategic planning (i.e. definition of priority interventions or understanding risks and vulnerabilities etc.). Different EO aided development projects has demonstrated the potentials of EO in water related project management.

For an example conducting projects on cross-boundary or trans-boundary water management issues are always difficult and complex in manner, regarding data collection and harmonization of available datasets where the particular advantage of EO is, EO service Information is globally consistent in nature that can facilitate the comparison capability of spatial facts and figures. Besides, EO based global water quality monitoring can identify where the water quality is deteriorating and requires local monitoring and water management program to tackle local challenges.

Last but not the least, EO also cal play a crucial role in project evaluation or impact assessment. Using EO information service we can very easily measure, either a water quality improvement project has met the goal or not by just analyzing satellite image in no time.

Conclusion:
The possibility of EO can potentially optimize the ground measurements and in such sense EO is simply awesome and can play a crucial role in water resource management but there are several changelings that we need to attain to successfully couple water specialist with EO. It’s obvious that EO information services are not widely used in the water resource management and one of the main reason of freely available EO data been underutilized due to the lack of staff capacity for processing and accessing EO data.

On the other hand the EO professionals’ density in land RS is remarkably higher than Water RS and to make water RS trendy, we should promote Water RS among the EO professionals. Besides, the number of studies/research on water RS or with water RS, are also not that significant, which should be enhanced by funding water RS related projects.