
“Eye care for all” is the motto of this year’s World Sight Day. But there are stark global inequalities in access to eye care. In 1971, Hart described the, ‘Inverse Care Law’ as the availability of good medical care varying inversely with the need for it in the population served. Hart was describing the situation in the National Health Service in Great Britain at the time in which he practiced as both a General Practitioner and an epidemiologist.
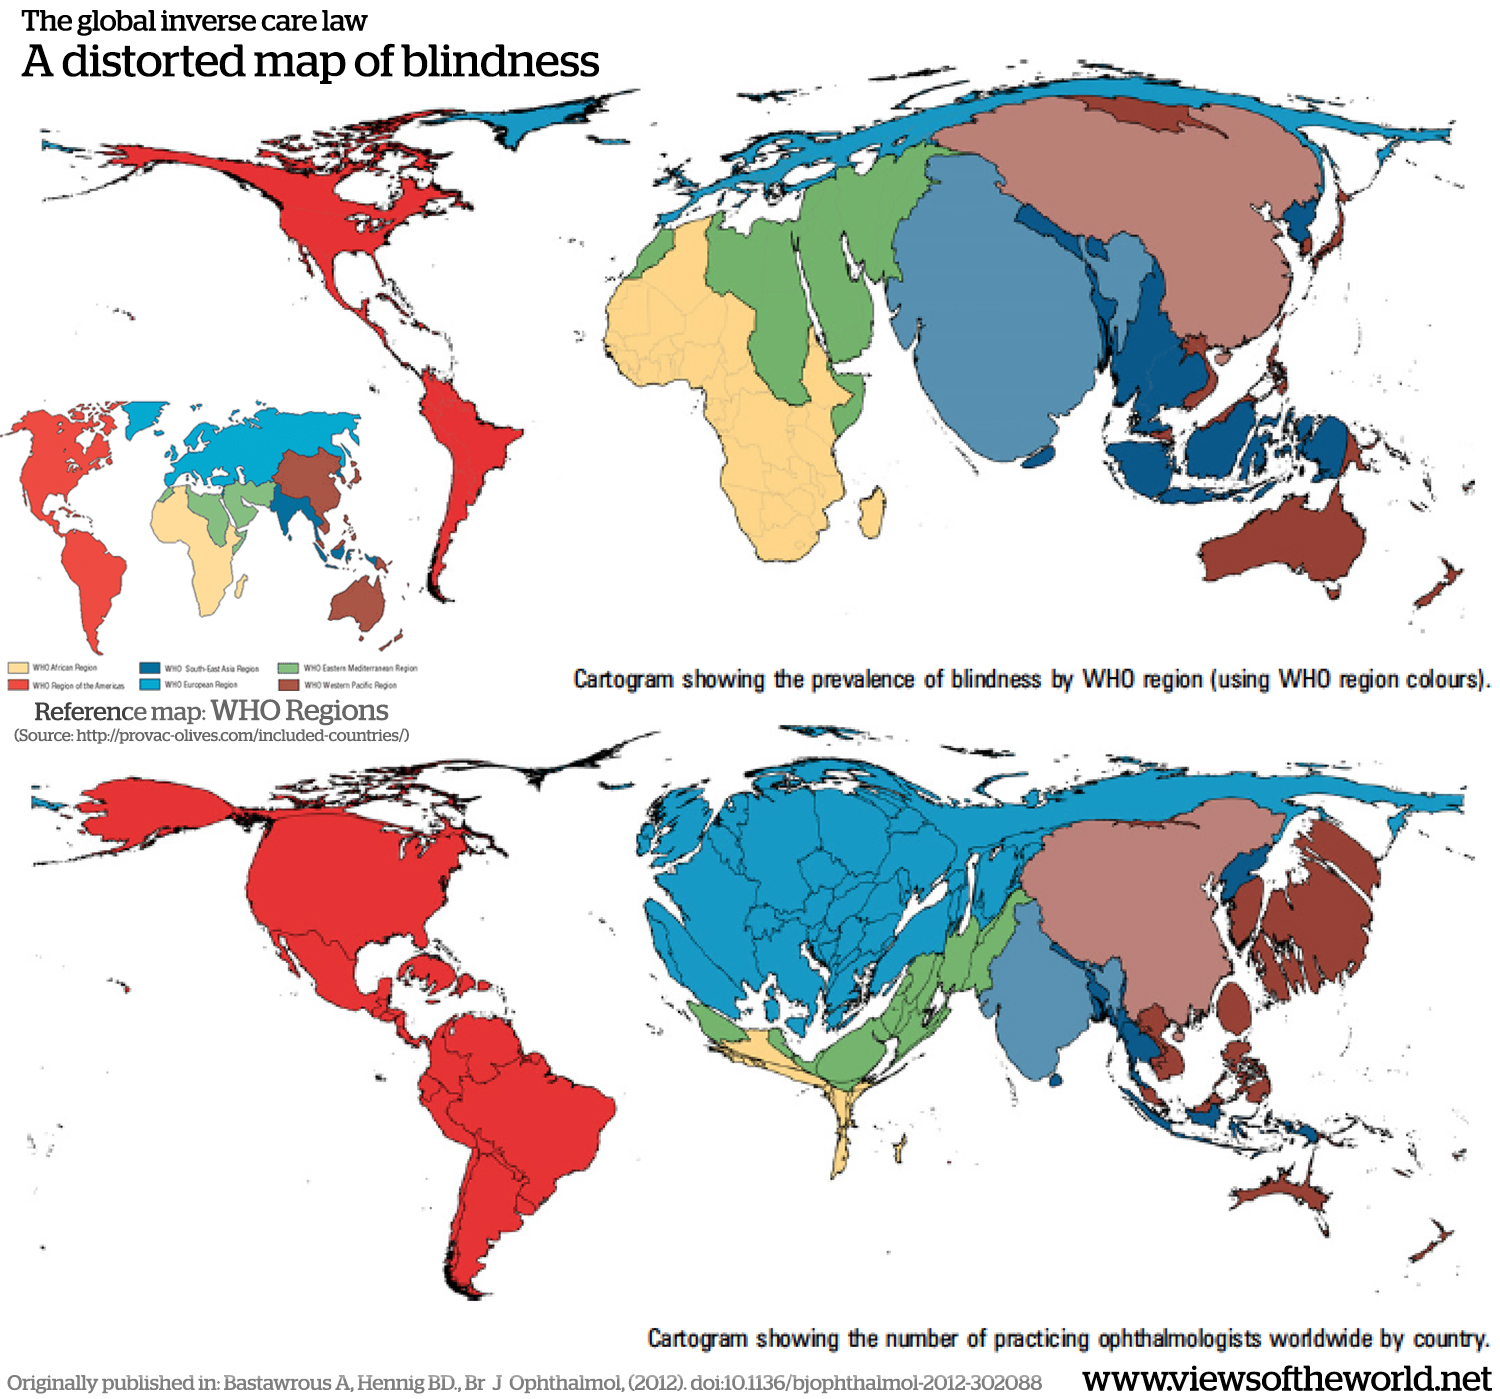
Two recently published articles demonstrate the ‘Inverse Care Law’ on a global level. The prevalence of blindness worldwide in 2010 was reported by the WHO and verified that low- and middle-income countries, as expected, have the highest prevalence of blindness and visual impairment. In stark contrast to this, a more recent report describes the,“Number of ophthalmologists in training and practice worldwide” providing global data for the number of ophthalmologists per county and demonstrates that despite a growing number in practice the gap between need and supply is widening.
The situation is also magnified within individual countries of high, middle and low-income. For example, in France, an inverse correlation was found between the number of ophthalmologists and the prevalence of low vision for subjects of similar age and socio-professional category and another example is in Kenya where of the 86 practicing ophthalmologists, 43 are based in Nairobi (personal correspondence). That equates to 50% of the countries ophthalmologists serving 8% of an already underserved population.
We have developed two cartograms to depict the data from these two papers using Gastner & Newman diffusion-based method. This allowed us to create density-equalised maps based on the absolute values provided in the papers. In the maps, each of the reference areas (WHO regions and countries) is resized according to these values. Larger areas represent higher numbers and smaller areas proportionally smaller data values:
Statistical analysis can be used to interpret and give meaning to data, however, the ability to interpret large quantities of data and its resulting statistical reporting is not always straightforward. Graphical representations such as graphs and maps are a way of translating or converting data into a visual interpretation.
Commonly used world maps are imperfect and contain distortions to allow a spherical reality to be represented in 2-dimensions. This distortion can be manipulated to produce a world map that gives each defined area (country or region) a size proportional to its population.
Cartograms are used to effectively map socioeconomic data and can be effective
means of mapping disease. In keeping with the phrase ‘a picture equals a thousand words’ cartograms can be used to analyse spatial data in an easily comprehensible style.
We believe the maps presented here can be used to share the data in a visual, intuitive and comprehensible way, which will be understood by policy makers and can be used by advocates for global health.
Read the full paper with all citations here:
Bastawrous, A. and Hennig, B.D. (2012). The global inverse care law: a distorted map of blindness. British Journal of Ophthalmology 96 (10): 1357-1358.
 Article as PDF; Article online (BJO)
The content on this page has been created by Benjamin Hennig in collaboration with Andrew Bastawrous. Please contact me for further details on the terms of use.
Source: Views of the World
Δεν υπάρχουν σχόλια:
Δημοσίευση σχολίου