
The growing amount of remotely sensed data and the ongoing developments in the improvement of spatial and spectral resolutions lead to high expectations. These often inflated expectations are usually not fulfilled. I explored these expectations and aimed to make a contribution to bring them to a more accurate level in research in the field of hyperspectral image analysis of small scale and heterogeneous biotopes in the intertidal zones of coastal areas which I undertook back at my time at the University of Cologne and the Alfred Wegener Institute for Polar and Marine Research Bremerhaven. Here are some insights from my work.

(click for larger version)
In a paper published with my colleagues Inka Bartsch and Chris Cogan following my research I discuss use of hyperspectral remote sensing methods in rocky intertidal areas. These methods were evaluated in a pilot study analyzing hyperspectral imagery from the rocky intertidal of Helgoland and the muddy intertidal of the Koenigshafen bay on Sylt. The goal was to assess as many details of biodiversity as possible in the intertidal study area using a high spectral resolution remote sensing sensor with a high spatial resolution instrument to detect the fine grain structure of the intertidal biotopes. For the aeriel survey, the ROSIS (Reflective Optics System Imaging Spectrometer) was used, an airborne sensor developed by the German Aerospace Centre (Deutsches Zentrum für Luft- und Raumfahrt – DLR), which (unlike spaceborne sensors) also allowed image acquisition times to be synchronized with low spring tides.
ROSIS operates with a pushbroom scanner technique which allows it to record all spectral responses of a pixel at the same time. The sensor covers 512 pixels in a row while a maxi-mum of 115 spectral bands from 430 nm in the visible light to 860 nm in the near infrared are covered. In our campaign over the North Sea a spatial resolution of 0.84 m per pixel was reached. The recorded data were delivered radi-ometrically and geometrically corrected. During preprocessing, a total of 14 so-called bad bands were eliminated leaving 101 spectral channels for the further analysis steps. The flight campaign was accompanied by a groundtruth survey, recording representative biological spots with the aid of a global positioning system (GPS).
The main part of this feasibility study was focused on hyperspectral image analysis, with the challenge of finding a suitable approach to analyze these complex coastal data. A 3D cube depiction of a section line in the northern intertidal gives a first impression of the high spectral variance especially in the near infrared region of the reflected light, indicating that these wavelengths are of special interest during data analysis.

(click for larger version)
The analysis that followed permitted to extract 20 spectral classes for the Helgoland area which were used to perform a SAM (Spectral Angle Mapper) classification. The comparison of the data with ecological background information and groundtruth data helped to summarize the classes and to match them with information on ecological features.
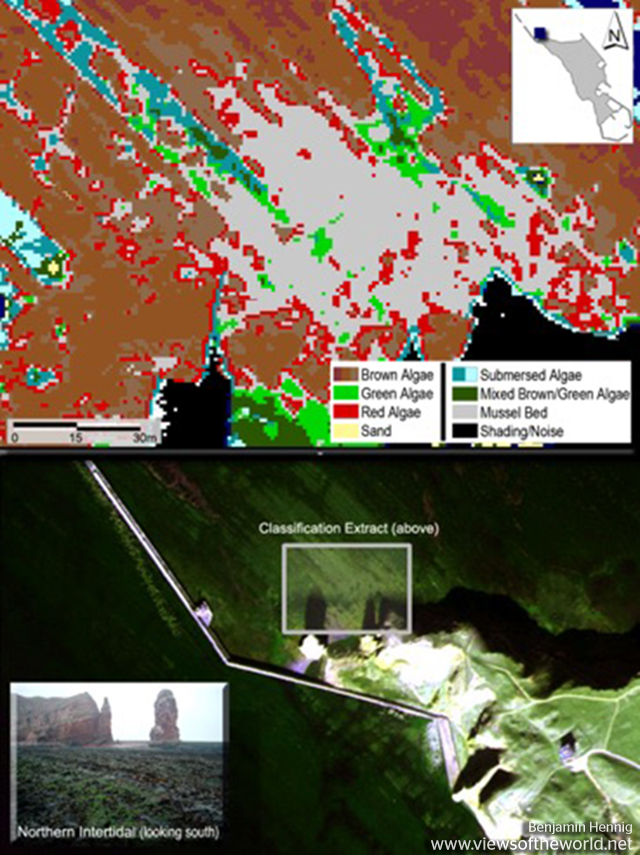
The spectral classes of the Helgoland classification corresponded well to the main vegetation types and discriminated the structures dominated by either red, green or brown sea-weeds as well as faunal habitats (e.g. poorly vegetated mussel beds). Differentiation of individual species had limited success and some mixed vegetation types were not confidentially classified. Further spectral classes separated water and sandy areas. The following image shows an extract of the feature class mapping in the northern intertidal of Helgoland opposed to a depiction of the ROSIS images. Among the mapped features are feature classes for red, green and brown algae. These classes have been summarized here from patches indicating different dense composition to more homogeneous classes to clarify the general distribution of the biotopes within this area.
Following the analysis, the paper then discusses the potential of hyperspectral image analysis for monitoring elements of coastal diversity apparent in this area and discusses the potential and limitations of the method.
The results from both study areas suggest that the general approach is a suitable way of analyzing hyperspectral data of intertidal coastal zones to obtain ecological information also of larger areas in an efficient manner. Background knowledge of the study area is inevitable to increase the precision of classification results. Nevertheless, detection of the same genus of species (e. g. different Fucus species) was not possible using this approach, indicating that remote sensing cannot replace basic field work. If, however, remote sensing data are taken back to the field, e. g. by integrating remote sensing data, classification results and further biotope information in portable, D-GPS linked mobile GIS environments, future field work can greatly benefit from the methodological developed here.
This is especially relevant for application-oriented monitoring of protected areas and for coastal zone management. The results show that a classification based on a spectral library allows a mapping of the dominant intertidal macrophyte vegetation and general intertidal structures. Limitations remain for separation of mixed vegetation types which cannot be identified without ancillary data sources. One major potential for future use of these methods is their efficiency for high-resolution geospatial data acquisition.

(click for larger version)
The integration of remote sensing techniques in GIS-based automated monitoring systems will help to combine different levels of resolution as well as different data sources needed to detect significant changes in structural and compositional coastal biodiversity. The success of this approach also depends on the selection of the best suitable imaging sensor and an appropriate analysis approach which fits the specific needs in the areas of investigation.
These are the bibliographic details of the paper:
Hennig, B.D., Cogan, C. and Bartsch, I. (2007). Hyperspectral remote sensing and analysis of intertidal zones – A contribution to monitor coastal biodiversity. In: Car, A., Griesebner, G. and Strobl, J. (eds): Geospatial crossroads @ GI_Forum. Salzburg (= Proceedings of the first geoinformatics forum), 62-73.
 Paper as PDF
I also presented the work at the 2007 GI_Forum where I showed the following slides:
View on Slideshare
The full thesis from this research can for copyright reasons of some of the data not be published online but is available upon request. Further material can be found on my website which I created for this work, where you can also find the two following posters summarizing my research:

Poster presentations


Disclaimer: No cartograms were used in this post!
The content on this page has been created by Benjamin Hennig in research conduted at the AWI Bremerhaven. Please contact me for further details on the terms of use.
Source: Views of the World
Δεν υπάρχουν σχόλια:
Δημοσίευση σχολίου