
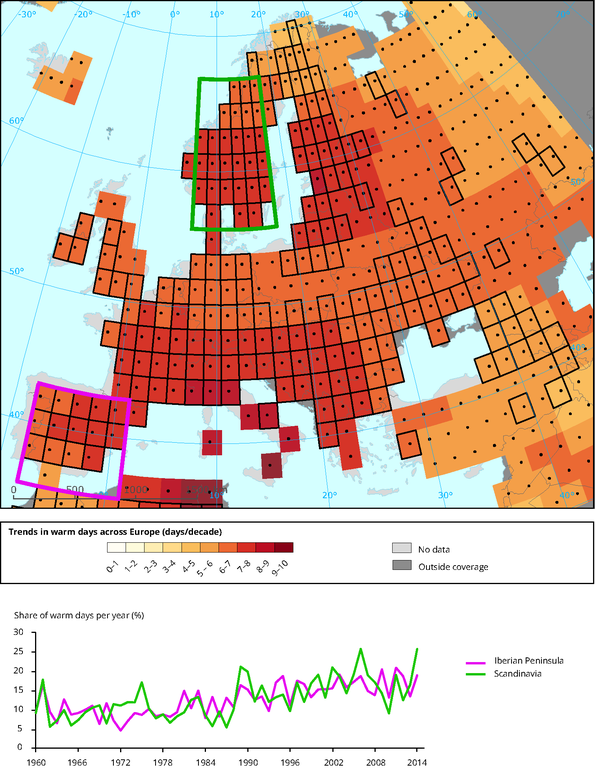
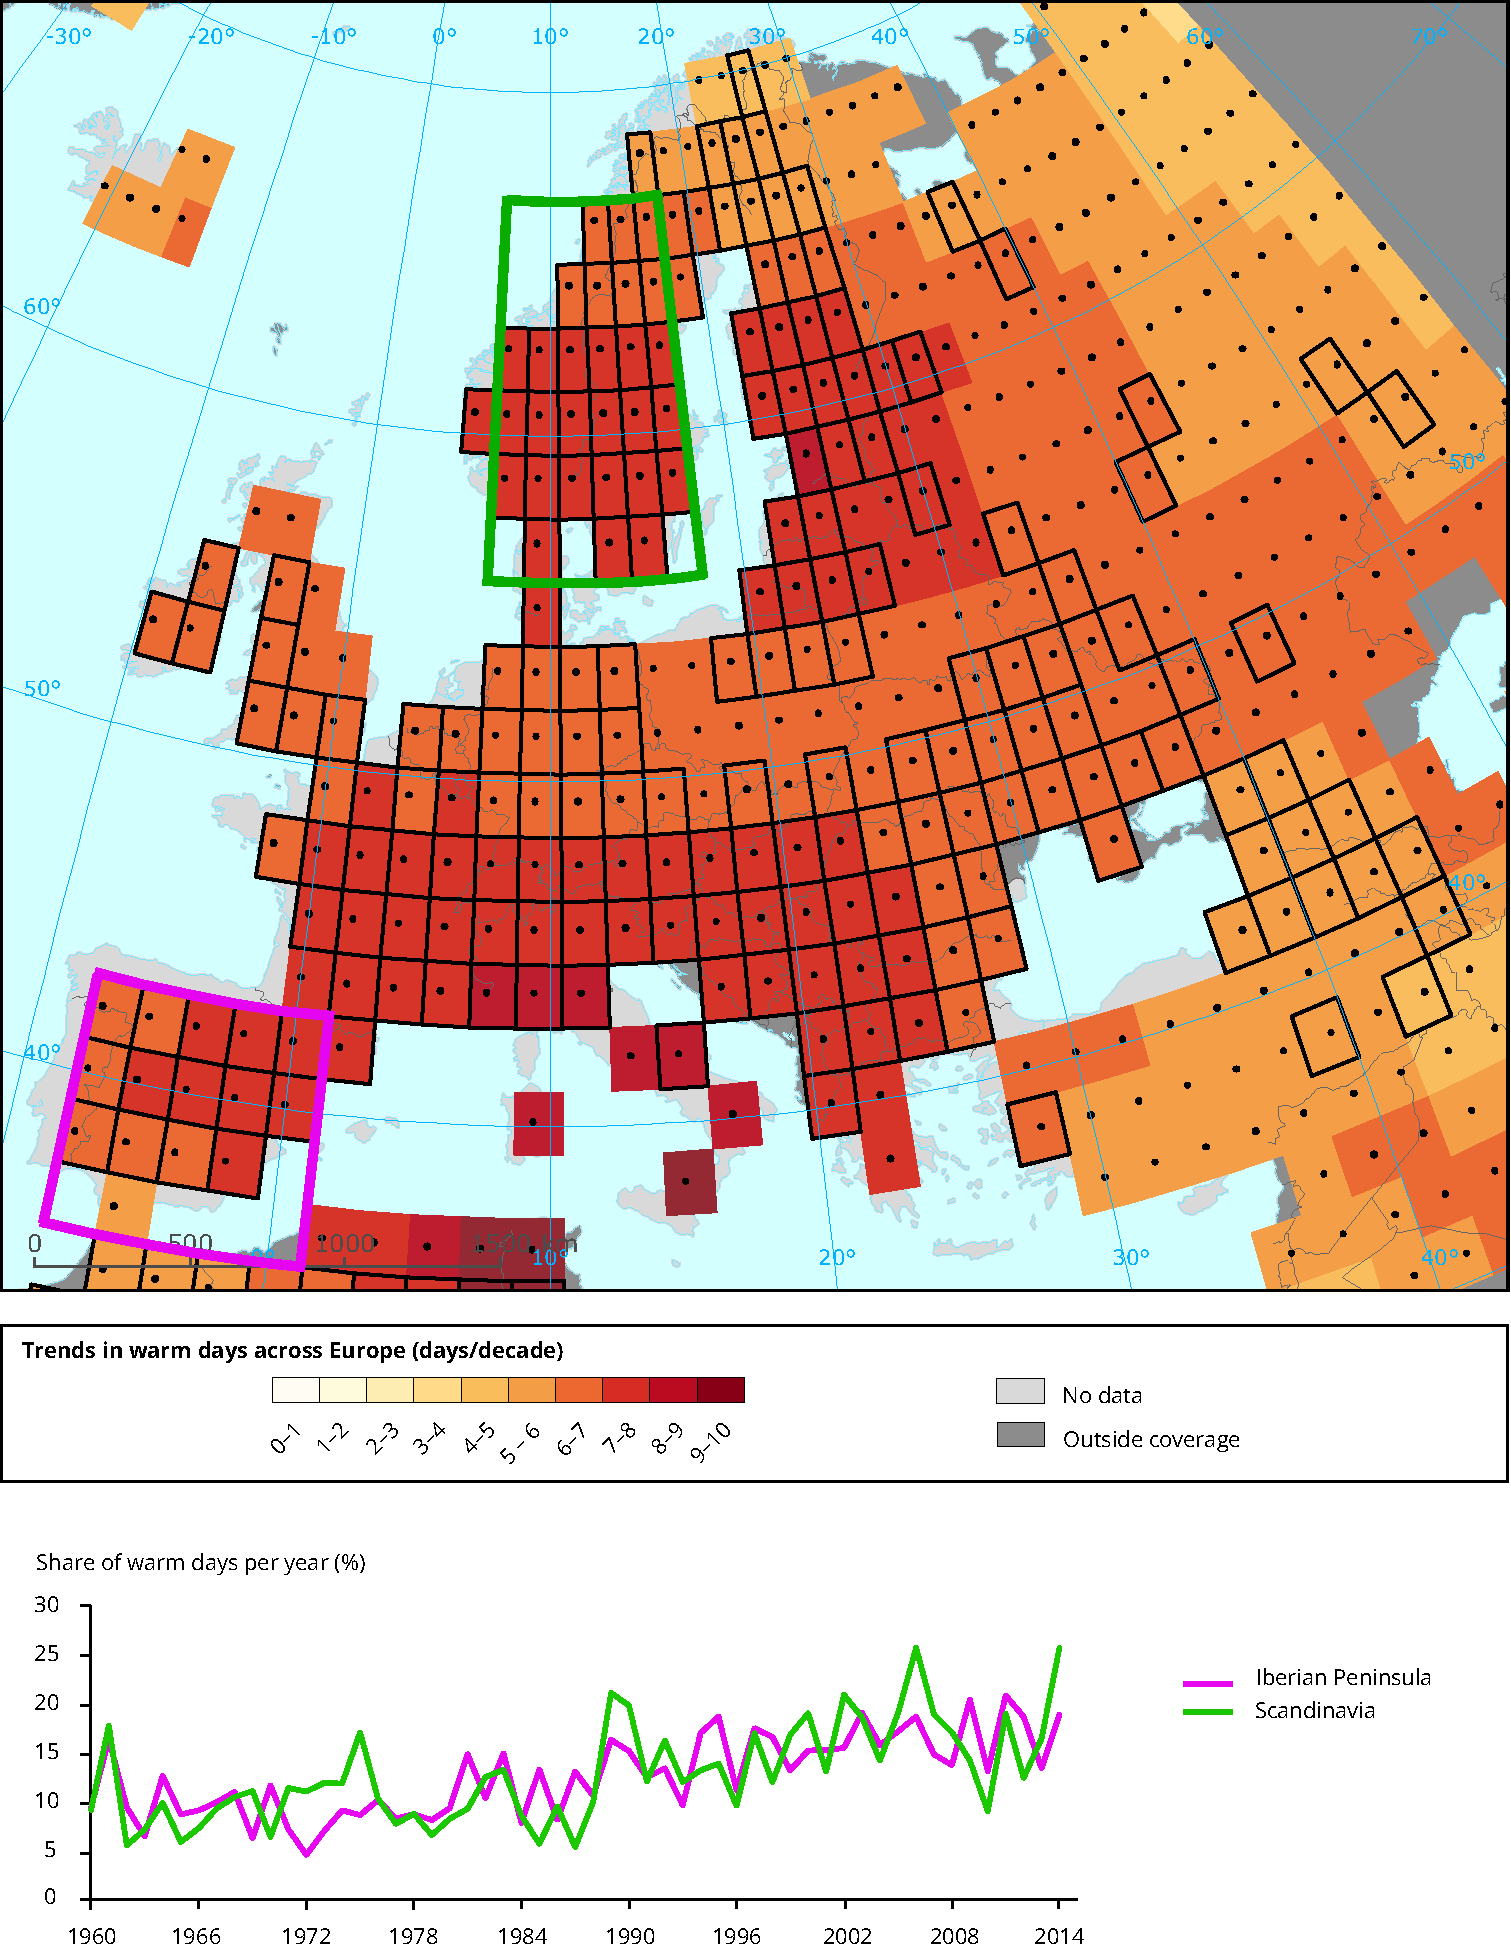
How to read the map: Warm days are defined as being above the 90th percentile of the daily maximum temperature. Grid boxes outlined in solid black contain at least 3 stations and so are likely to be more representative of the grid-box. Higher confidence in the long-term trend is shown by a black dot.
Download
map_chart_25400.eps.75dpi.gif (1.8 MB)
map_chart_25400.eps.75dpi.tif (8.4 MB)
map_chart_25400.eps.75dpi.png (152.1 KB)
Original file application/postscript (6.54 MB)
Metadata
 Last upload:
Temporal coverage:
Tags:
Geographic coverage:
Albania, Austria, Belgium, Bosnia and Herzegovina, Bulgaria, Croatia, Cyprus, Czech Republic,Denmark, Estonia, Finland, France, Germany, Greece, Hungary, Iceland, Ireland, Italy, Kosovo (UNSCR 1244/99), Latvia, Liechtenstein, Lithuania, Luxembourg, Malta, Montenegro,Netherlands, Norway, Poland, Portugal, Romania, Serbia, Slovakia, Slovenia, Spain, Sweden,Switzerland, The Former Yugoslav Republic of Macedonia, Turkey, United Kingdom
Units:
days/decade
Rights:
map_chart_25400.eps.75dpi.gif (1.8 MB)
map_chart_25400.eps.75dpi.tif (8.4 MB)
map_chart_25400.eps.75dpi.png (152.1 KB)
Original file application/postscript (6.54 MB)
Metadata
Last upload:
22 Jun 2015
Temporal coverage:
1960-2014
Tags: Geographic coverage:Albania, Austria, Belgium, Bosnia and Herzegovina, Bulgaria, Croatia, Cyprus, Czech Republic,Denmark, Estonia, Finland, France, Germany, Greece, Hungary, Iceland, Ireland, Italy, Kosovo (UNSCR 1244/99), Latvia, Liechtenstein, Lithuania, Luxembourg, Malta, Montenegro,Netherlands, Norway, Poland, Portugal, Romania, Serbia, Slovakia, Slovenia, Spain, Sweden,Switzerland, The Former Yugoslav Republic of Macedonia, Turkey, United Kingdom
Units:days/decade
Rights:
Access is managed by the owner mentioned below. Please contact the owner for more information about their data policy. Owners:Royal Netherlands Meteorological Institute (KNMI)UK Met Office Processors:European Environment Agency (EEA)Permalink to this versionabdcc122d76140479fc0e74abbe73113Permalink to latest versionD702EDEE-08D7-4687-B717-690A71819BA8 Figure type:Map
Additional information
Geographical coverage note: Europe
Owners:Royal Netherlands Meteorological Institute (KNMI)UK Met Office Processors:European Environment Agency (EEA)Permalink to this versionabdcc122d76140479fc0e74abbe73113Permalink to latest versionD702EDEE-08D7-4687-B717-690A71819BA8 Figure type:MapAdditional information
Geographical coverage note: Europe
Source: EEA
Δεν υπάρχουν σχόλια:
Δημοσίευση σχολίου